Read and Plot NetCDF Data in Python with xarray and rioxarray
A few months ago I wrote an article about reading NetCDF data with Python. This article still receives many views on my website and on Medium. However, since then, I’ve found an even better way to read NetCDF data with Python.
In the initial article, I used the netCDF4 Python package to access data from NetCDF files. Recently, I’ve started using rioxarray to read NetCDF data into xarray format. If you’re not familiar with the xarray python package it’s basically a wrapper (for lack of a better term) around numpy arrays that allows metadata to be included with the arrays (more on this later with an example).
While the netCDF4 package is a complete, powerful package for interesting with NetCDF data, rioxarray provides more simple and concise data access that will be preferred by most users.
Why NetCDF
Those just getting started with NetCDF may find it a slightly confusing data format. NetCDF is based on the HDF5 file format, which allows for the segregation of metadata and different data types in the same file. This type of format is very powerful because it provides detailed documentation for the data and can store large volumes of data in an easily accessible way.
The NetCDF file format lends itself to climate data especially well. Datasets of climatic data, like precipitation and temperature, usually have repeat values at each recorded location at equally spaced time intervals. With NetCDF, the spatial structure of the data can be defined once, and then new data layers are added to the existing spatial definition.
You’ll learn more about this as we go through some examples.
Download NetCDF Data
For this example, I’ll be using 2020 daily precipitation data from the GRIDMET dataset. You can download the same data I’m using at the following link: https://www.northwestknowledge.net/metdata/data/pr_2020.nc.
Once downloaded, make note of the file location so you can read it into your Python environment later.
Install rioxarray
I recommend using Anaconda (or miniconda) for your Python environment and package management. I find it just makes things easier. This is especially true if you are newer to Python. For this tutorial, I created a fresh conda environment (conda create --name myenv python=3.9) then installed the required packages.
rioxarray is available from Anaconda’s conda-forge channel. It can be easily installed with the following command.
conda install -c conda-forge rioxarrayNote: If you are using the suggested data for this tutorial, you may get the following error when you try to read the NetCDF file (depending on your python environment and operating system.
ValueError: unable to decode time units 'days since 1900-01-01 00:00:00' with "calendar 'gregorian'". Try opening your dataset with decode_times=False or installing cftime if it is not installed.This is easily fixed by installing the cftime package as indicated in the error message. For anaconda, install with the following line of code.
conda install -c conda-forge cftimeInstall matplotlib
We’ll also install the matplotlib package, which will give us the ability to seamlessly plot the NetCDF data we read. We can install matplotlib in the same manner as the other packages.
conda install -c conda-forge matplotlibRead NetCDF with rioxarray
Here, I’m inserting a Jupyter notebook (in HTML format) to show how to use rioxarray and xarray to read and plot NetCDF data (that’s why the formatting will be a little different).
To start, we’ll need to import some libraries. First, rioxarray which is what we’ll use to read in the NetCDF file. Next matplotlib to plot data. Finally, xarray, which is the package defining the data format read in by rioxarray. Be sure you’ve followed the above directions to install these packages. You don’t need to explicitly install xarray it is installed along with rioxarray.
import rioxarray
import matplotlib.pyplot as plt
import xarray
Now, set the path to the netcdf file and open it with rioxarray.open_rasterio as shown below. The open_rasterio function draws on the rasterio package for reading gridded spatial data. You could also read the data with rasterio but with rasterio it’s much more difficult to read and plot multi-band data.
fn = 'C:/temp/pr_2020.nc'
xr = rioxarray.open_rasterio(fn)
For simplicity, we’re going to change the ‘units’ attribute of the NetCDF file. In the original file, ‘units’ is a tuple that gives the units of measure for each band/layer in the NetCDF. These units are the same for every day (mm). Changing this value to ‘mm’ (instead of a tuple of 366 repetitions of ‘mm’) will just make our plots easier to create/read. You can run xr.attrs to see the original attribute list.
xr.attrs['units'] = 'mm'
Print out the dims, attrs, and coords properties of xr to see how the data are structured.
print(xr.dims)
print(xr.attrs)
print(xr.coords)
('day', 'y', 'x')
{'add_offset': 0.0, 'coordinates': 'lon lat', 'coordinate_system': 'WGS84,EPSG:4326', 'description': 'Daily Accumulated Precipitation', 'dimensions': 'lon lat time', 'long_name': 'pr', 'missing_value': 32767, 'scale_factor': 0.1, 'standard_name': 'pr', 'units': 'mm', '_FillValue': 32767.0, '_Unsigned': 'true'}
Coordinates:
  * day      (day) object 2020-01-01 00:00:00 ... 2020-12-31 00:00:00
  * x        (x) float64 -124.8 -124.7 -124.7 -124.6 ... -67.14 -67.1 -67.06
  * y        (y) float64 49.4 49.36 49.32 49.28 ... 25.19 25.15 25.11 25.07
    crs      int32 0
The data above gives important information about the structure of the dataset. Note the scale_factor value of 0.1. This means you need to multiply the data values by 0.1 to get them in the correct units. For this tutorial I’m not going to do the multiplication, just be aware of the value for when you do actual analysis. Not all datasets will have a scale factor. We’ll use other pieces of this information to access data and create some plots.
Access NetCDF Data with xarray
To start let’s get a spatial slice of data for a specific day. The code below prints out an array for rows 100-105 and columns 100-105 in the dataset on the 113th day of the year.
xr[112, 100:105, 100:105]
<xarray.DataArray 'precipitation_amount' (y: 5, x: 5)>
array([[42, 38, 42, 41, 38],
       [43, 45, 41, 36, 41],
       [44, 46, 48, 43, 43],
       [52, 55, 55, 49, 50],
       [53, 55, 55, 46, 51]], dtype=uint16)
Coordinates:
    day      object 2020-04-22 00:00:00
  * x        (x) float64 -120.6 -120.6 -120.5 -120.5 -120.4
  * y        (y) float64 45.23 45.19 45.15 45.11 45.07
    crs      int32 0
Attributes:
    add_offset:         0.0
    coordinates:        lon lat
    coordinate_system:  WGS84,EPSG:4326
    description:        Daily Accumulated Precipitation
    dimensions:         lon lat time
    long_name:          pr
    missing_value:      32767
    scale_factor:       0.1
    standard_name:      pr
    units:              mm
    _FillValue:         32767.0
_Unsigned: true- y: 5
- x: 5
- 42 38 42 41 38 43 45 41 36 41 44 … 43 52 55 55 49 50 53 55 55 46 51
array([[42, 38, 42, 41, 38], [43, 45, 41, 36, 41], [44, 46, 48, 43, 43], [52, 55, 55, 49, 50], [53, 55, 55, 46, 51]], dtype=uint16) - day()object2020-04-22 00:00:00
- description :
- days since 1900-01-01
- long_name :
- time
- standard_name :
- time
array(cftime.DatetimeGregorian(2020, 4, 22, 0, 0, 0, 0, has_year_zero=False), dtype=object) - x(x)float64-120.6 -120.6 -120.5 -120.5 -120.4
array([-120.6 , -120.558333, -120.516667, -120.475 , -120.433333])
- y(y)float6445.23 45.19 45.15 45.11 45.07
array([45.233333, 45.191667, 45.15 , 45.108333, 45.066667])
- crs()int320
- crs_wkt :
- GEOGCS["WGS 84",DATUM["WGS_1984",SPHEROID["WGS 84",6378137,298.257223563,AUTHORITY["EPSG","7030"]],AUTHORITY["EPSG","6326"]],PRIMEM["Greenwich",0,AUTHORITY["EPSG","8901"]],UNIT["degree",0.0174532925199433,AUTHORITY["EPSG","9122"]],AXIS["Latitude",NORTH],AXIS["Longitude",EAST],AUTHORITY["EPSG","4326"]]
- semi_major_axis :
- 6378137.0
- semi_minor_axis :
- 6356752.314245179
- inverse_flattening :
- 298.257223563
- reference_ellipsoid_name :
- WGS 84
- longitude_of_prime_meridian :
- 0.0
- prime_meridian_name :
- Greenwich
- geographic_crs_name :
- WGS 84
- grid_mapping_name :
- latitude_longitude
- spatial_ref :
- GEOGCS["WGS 84",DATUM["WGS_1984",SPHEROID["WGS 84",6378137,298.257223563,AUTHORITY["EPSG","7030"]],AUTHORITY["EPSG","6326"]],PRIMEM["Greenwich",0,AUTHORITY["EPSG","8901"]],UNIT["degree",0.0174532925199433,AUTHORITY["EPSG","9122"]],AXIS["Latitude",NORTH],AXIS["Longitude",EAST],AUTHORITY["EPSG","4326"]]
- GeoTransform :
- -124.78749996666667 0.041666666666666664 0.0 49.42083333333334 0.0 -0.04166666666666668
array(0)
- add_offset :
- 0.0
- coordinates :
- lon lat
- coordinate_system :
- WGS84,EPSG:4326
- description :
- Daily Accumulated Precipitation
- dimensions :
- lon lat time
- long_name :
- pr
- missing_value :
- 32767
- scale_factor :
- 0.1
- standard_name :
- pr
- units :
- mm
- _FillValue :
- 32767.0
- _Unsigned :
- true
You can follow this same procedure to access other time slices. To get all data on a specific day use xr[0, :, :] (for the first day of the year).
To get values for every day at a specific location (row, column) use xr[:, 100, 100] (for the 100th row and 100th column).
Plotting NetCDF Data with xarray
With xarray we have the ability to integrate seamless plotting of NetCDF data. Let’s start by plotting a time-series of precipitation at a specific location.
Here we plot daily precipitation for the year 2020 at the location defined by the 100th row and 100th column in the dataset.
xr[:, 100, 100].plot()
[<matplotlib.lines.Line2D at 0x22970e050a0>]

When plotting with xarray it’s important to consider the dimension of the array that is being plotted. 1D arrays will be plotted as a timeseries line graph. 2D arrays will be plotted in map format (see below for an example).
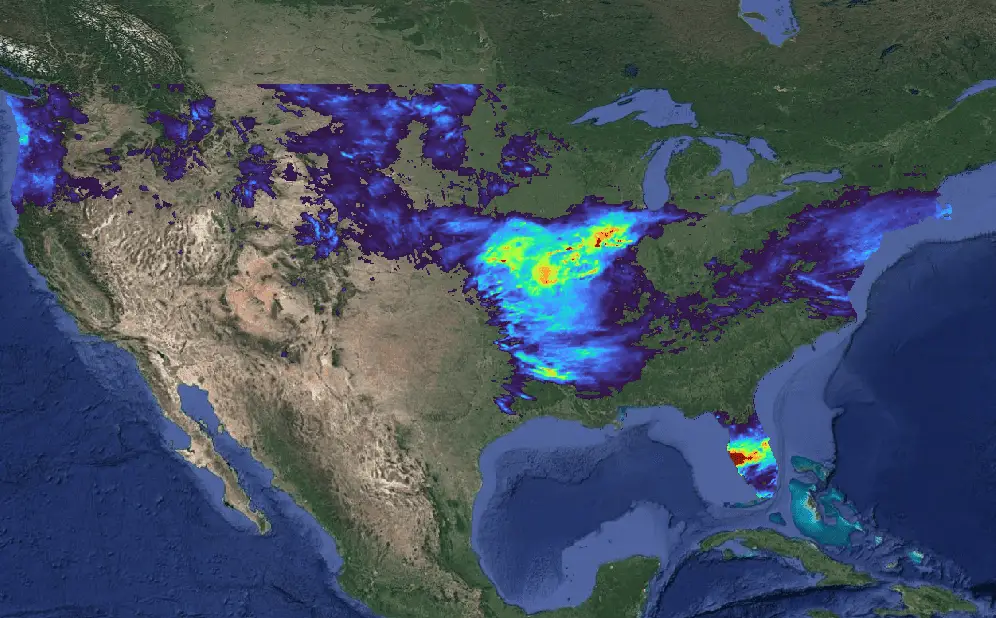
Now let’s plot a map of precipitation for the entire United States on the 113th day of 2020. Before we can plot the map we need to exclude missing values or they’ll be included in the map as actual values and the symbology won’t scale properly.
To do this, we’ll created a masked verion of our original array by selecting values that are not equal to the missing_value from attrs. Then select all rows and columns for the 113th day (index 112) and plot.
The code below is pulling from a lot of data so it may take a few minutes to run. Be patient!
xr_masked = xr.where(xr != xr.attrs['missing_value'])
xr_masked[112, :, :].plot()
<matplotlib.collections.QuadMesh at 0x22973c3aa30>

Calculating and Plotting Statistics for a NetCDF File
With the masked data we can now calculate some basic statistics. It’s important to excluded missing values before computing statistics so that the values are not erroneously included in the calculation.
With xarray we can call most of the same functions we could on a numpy array. For example, we can get the average precipitation for the entire United States during 2020 with just one line of code.
xr_masked.mean()
<xarray.DataArray 'precipitation_amount' ()>
array(22.14306263)
Coordinates:
crs int32 0- 22.14
array(22.14306263)
- crs()int320
- crs_wkt :
- GEOGCS["WGS 84",DATUM["WGS_1984",SPHEROID["WGS 84",6378137,298.257223563,AUTHORITY["EPSG","7030"]],AUTHORITY["EPSG","6326"]],PRIMEM["Greenwich",0,AUTHORITY["EPSG","8901"]],UNIT["degree",0.0174532925199433,AUTHORITY["EPSG","9122"]],AXIS["Latitude",NORTH],AXIS["Longitude",EAST],AUTHORITY["EPSG","4326"]]
- semi_major_axis :
- 6378137.0
- semi_minor_axis :
- 6356752.314245179
- inverse_flattening :
- 298.257223563
- reference_ellipsoid_name :
- WGS 84
- longitude_of_prime_meridian :
- 0.0
- prime_meridian_name :
- Greenwich
- geographic_crs_name :
- WGS 84
- grid_mapping_name :
- latitude_longitude
- spatial_ref :
- GEOGCS["WGS 84",DATUM["WGS_1984",SPHEROID["WGS 84",6378137,298.257223563,AUTHORITY["EPSG","7030"]],AUTHORITY["EPSG","6326"]],PRIMEM["Greenwich",0,AUTHORITY["EPSG","8901"]],UNIT["degree",0.0174532925199433,AUTHORITY["EPSG","9122"]],AXIS["Latitude",NORTH],AXIS["Longitude",EAST],AUTHORITY["EPSG","4326"]]
- GeoTransform :
- -124.78749996666667 0.041666666666666664 0.0 49.42083333333334 0.0 -0.04166666666666668
array(0)
To get the actual value we’ll need to multiple by the scale factor. That can be done as follows. The average daily precip for 2020 was 2.2 mm.
xr_masked.mean() * xr.attrs['scale_factor']
<xarray.DataArray 'precipitation_amount' ()>
array(2.21430626)
Coordinates:
crs int32 0- 2.214
array(2.21430626)
- crs()int320
- crs_wkt :
- GEOGCS["WGS 84",DATUM["WGS_1984",SPHEROID["WGS 84",6378137,298.257223563,AUTHORITY["EPSG","7030"]],AUTHORITY["EPSG","6326"]],PRIMEM["Greenwich",0,AUTHORITY["EPSG","8901"]],UNIT["degree",0.0174532925199433,AUTHORITY["EPSG","9122"]],AXIS["Latitude",NORTH],AXIS["Longitude",EAST],AUTHORITY["EPSG","4326"]]
- semi_major_axis :
- 6378137.0
- semi_minor_axis :
- 6356752.314245179
- inverse_flattening :
- 298.257223563
- reference_ellipsoid_name :
- WGS 84
- longitude_of_prime_meridian :
- 0.0
- prime_meridian_name :
- Greenwich
- geographic_crs_name :
- WGS 84
- grid_mapping_name :
- latitude_longitude
- spatial_ref :
- GEOGCS["WGS 84",DATUM["WGS_1984",SPHEROID["WGS 84",6378137,298.257223563,AUTHORITY["EPSG","7030"]],AUTHORITY["EPSG","6326"]],PRIMEM["Greenwich",0,AUTHORITY["EPSG","8901"]],UNIT["degree",0.0174532925199433,AUTHORITY["EPSG","9122"]],AXIS["Latitude",NORTH],AXIS["Longitude",EAST],AUTHORITY["EPSG","4326"]]
- GeoTransform :
- -124.78749996666667 0.041666666666666664 0.0 49.42083333333334 0.0 -0.04166666666666668
array(0)
We can also plot a map of average precipitation across the US with the following line of code.
xr_masked.mean(dim='day').plot()
<matplotlib.collections.QuadMesh at 0x229710e8580>

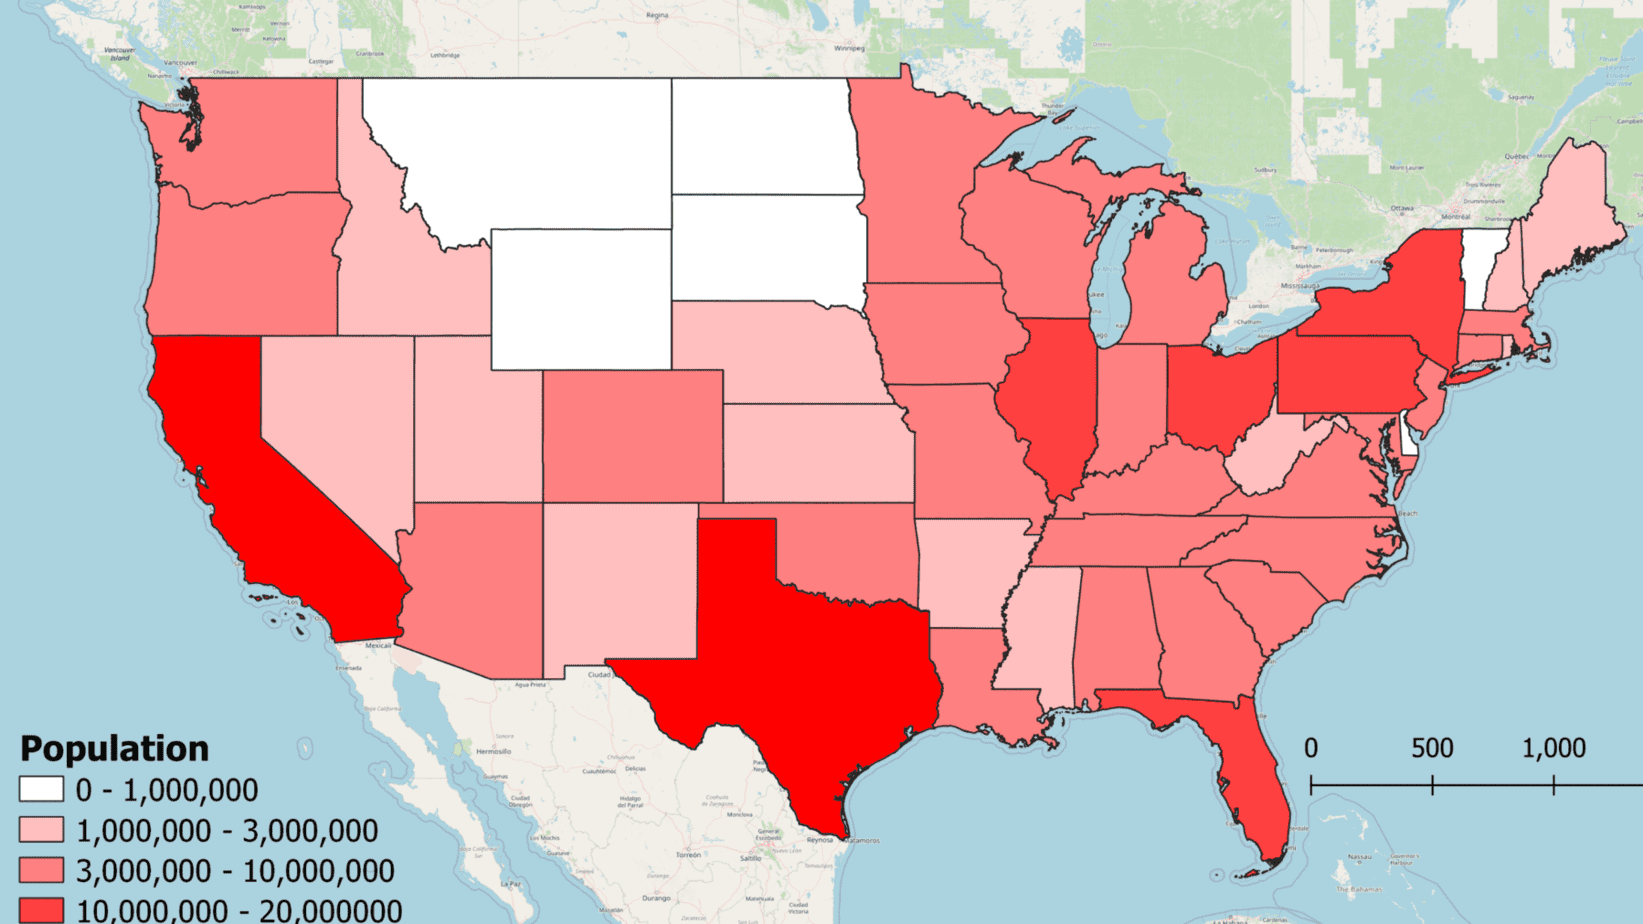
As you probably realize, it might be more useful to plot the total annual precipitation. We can do this (and adjust by the scale factor) as follows.
(xr_masked.sum(dim='day') * xr.attrs['scale_factor']).plot()
<matplotlib.collections.QuadMesh at 0x2297192dc70>

Conclusion
As you can see, using rioxarray to read NetCDF data gives you access to the power of xarray objects and numpy. This makes it nearly seamless to plot different slices of a NetCDF file as maps and time series plots. It also makes it easy to calculate basic statistics and plot them through time and space as desired.
At first, I was reluctant to learn rioxarray and xarray but these powerful packages are definitely worth the time invested in learning them.
Whether you’re looking to take your GIS skills to the next level, or just getting started with GIS, we have a course for you! We’re constantly creating and curating more courses to help you improve your geospatial skills.

All of our courses are taught by industry professionals and include step-by-step video instruction so you don’t get lost in YouTube videos and blog posts, downloadable data so you can reproduce everything the instructor does, and code you can copy so you can avoid repetitive typing