How to Create Contour Lines and Labels with QGIS
Contour lines are most often used to represent topography on two-dimensional maps and figures. However, they can represent spatially changing values for any variable. Creating, styling, and labeling contour lines can be a little tedious, and it takes a little bit of time to learn exactly which tools to use to do this in QGIS.
This tutorial will demonstrate the basics of how to create, style, and label contour lines in QGIS. I will also introduce some advanced concepts that will help you automatically label or style features based on attribute table values. This tutorial uses a digital elevation model (or DEM) to generate topographic contours.
Add a Digital Elevation Model to QGIS
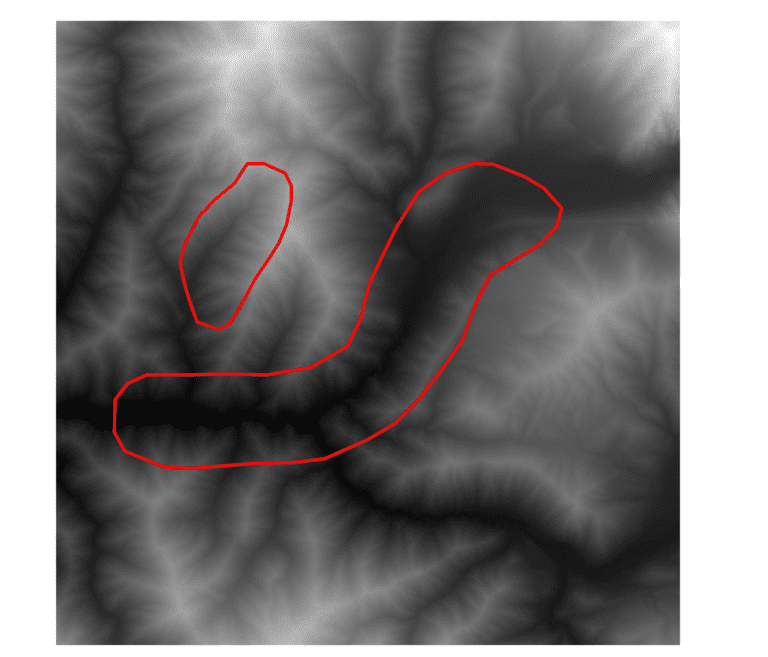
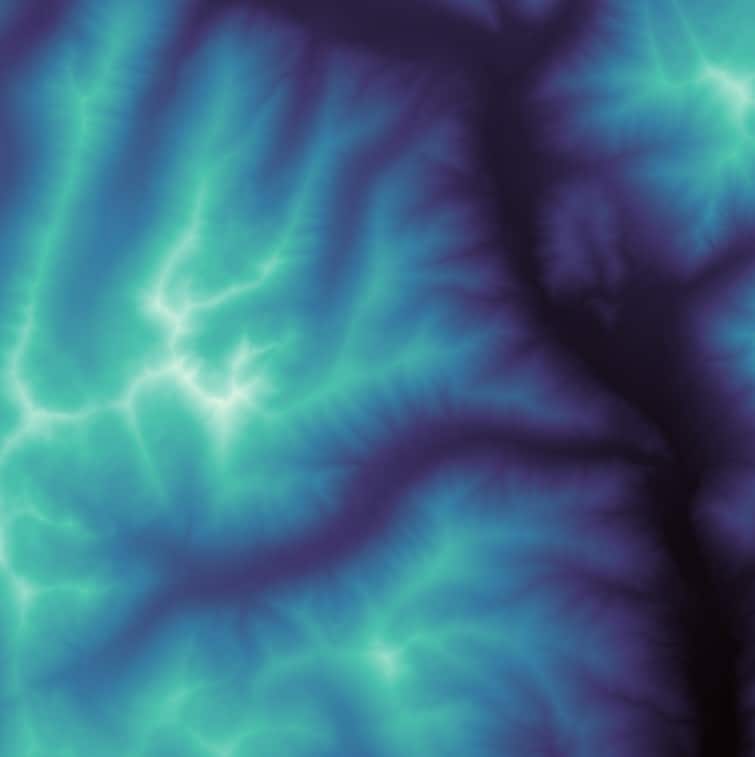
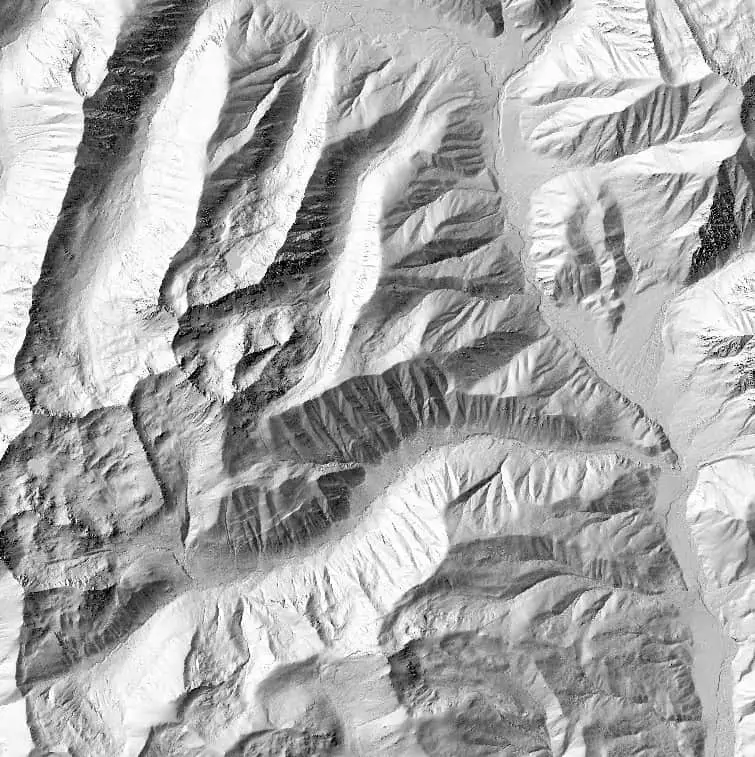
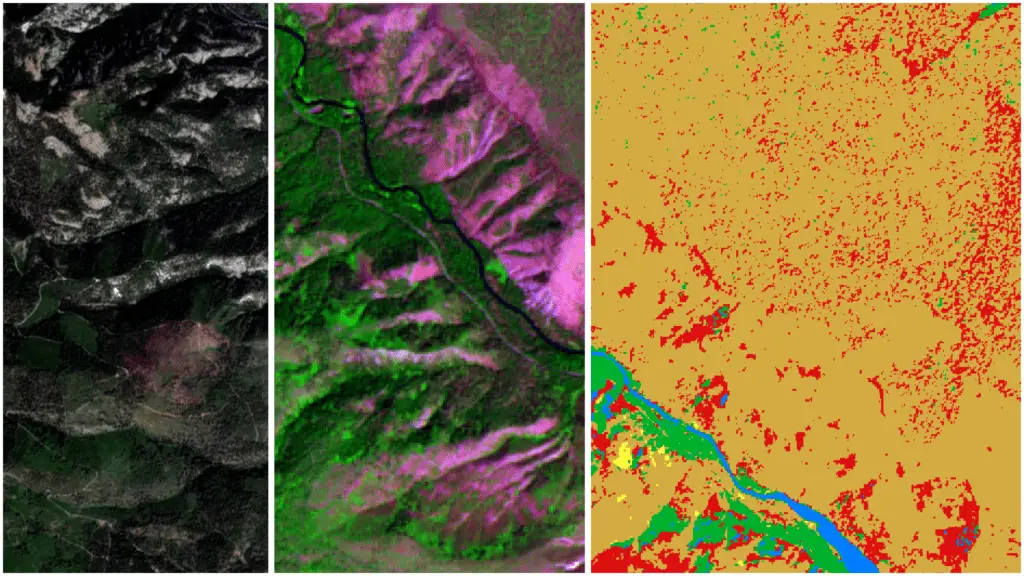
To start, you’ll need to add a DEM to QGIS. I’m using a high-resolution lidar DEM from the USGS. You can follow this tutorial to download a similar DEM. Also, members of my QGIS course have access to a DEM in the course data. The images below display a portion of the DEM I am using. If you’re new to QGIS, you learn the basics in this tutorial to get up to speed.
It’s important to know the vertical units for your DEM. The DEM I am using has vertical units of meters.
Create Contour Lines
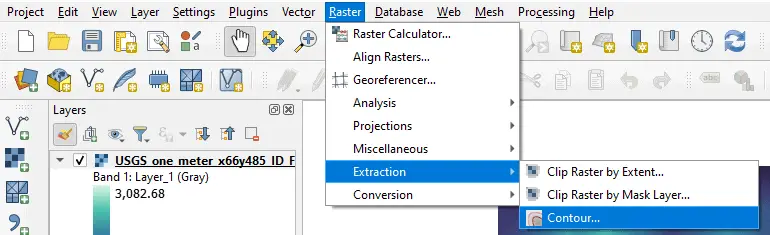
In QGIS, contour lines can be easily created using the ‘Contour’ tool, which can be accessed on the QGIS Main Menu from Raster > Extraction > Contour.
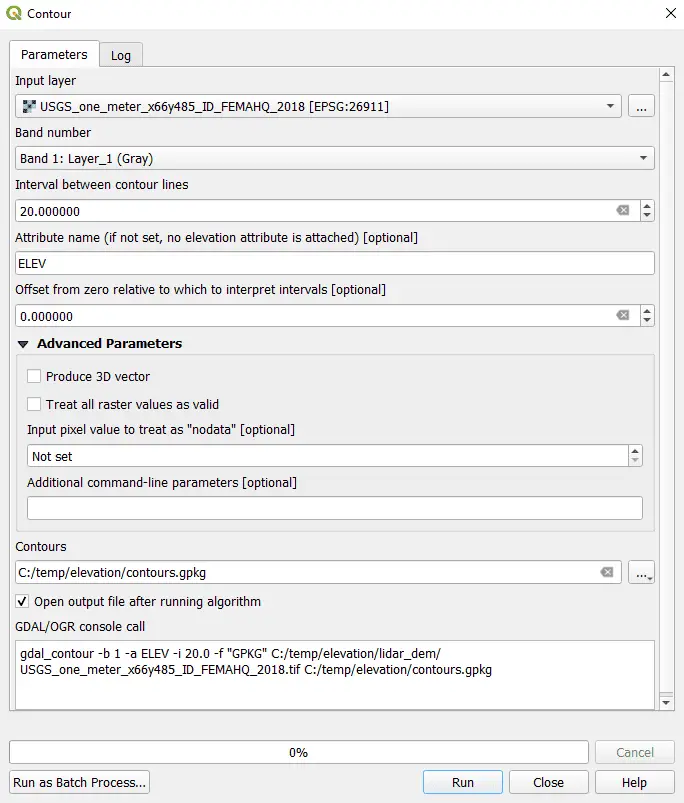
Selecting the Contour tool will open a new window where you will specify the parameters that generate contours (see image below). You will most likely only adjust one or two parameters, but I’ve included a description for each of the parameters to help you understand their meaning.
- Input layer: the input DEM to generate contours from. You can either select a layer from the drop-down or select a file from your system.
- Band number: the band number of the input raster to use when generating contours.
- Interval between contour lines: the vertical distance between contour lines (this will be in the vertical units of your DEM), I’ve specified the contour lines to be spaced 20 meters apart
- Attribute name: the name of the attribute table column where the elevation of each contour line is recorded
- Offset from zero: if you want intervals to start at an elevation different than zero. For example, if you specified contours be spaced every 100 m and set the ‘offset from zero’ to be 50 m then contours would be placed at elevations of 150 m, 250 m, 350 m, etc.
- Contours: the output contour file to be generated. The contours will be a vector file. For this example, I’m exporting the contour in a GeoPackage format.
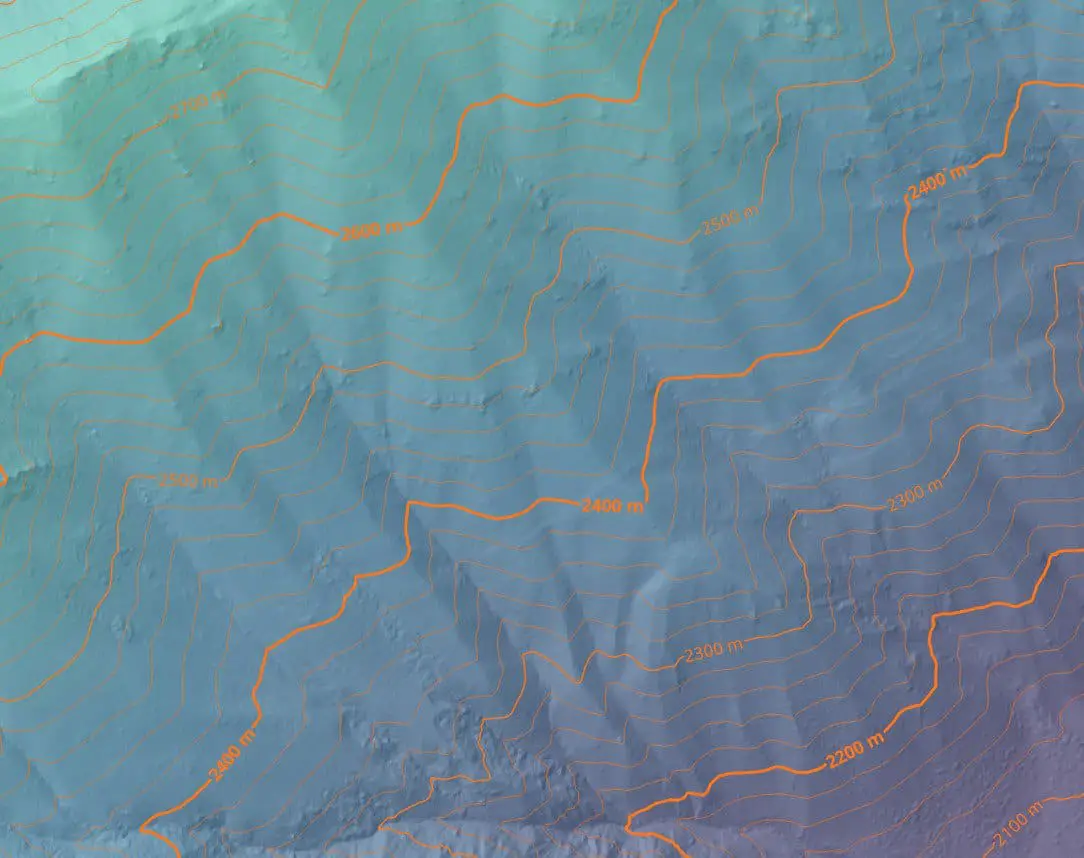
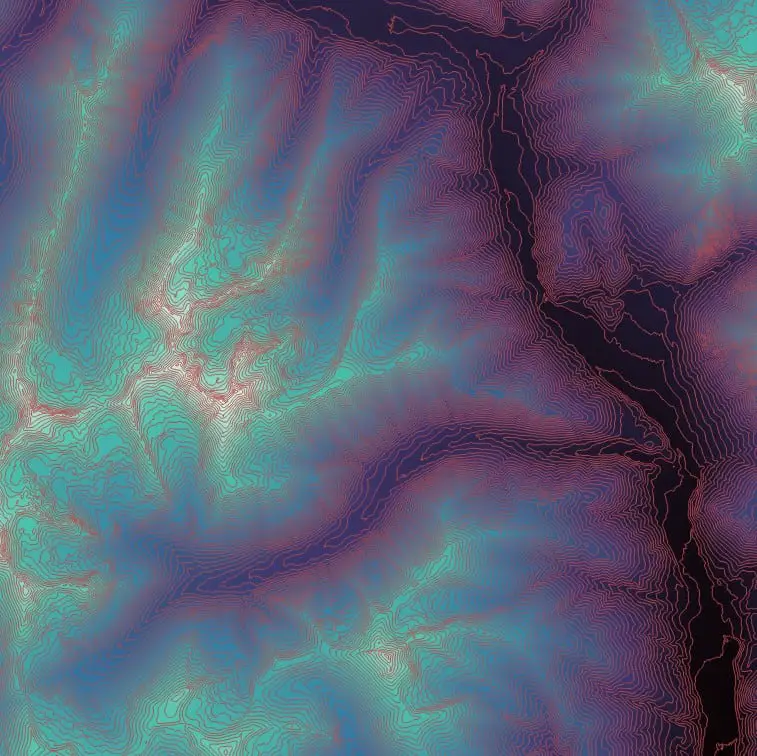
Once you’ve specified parameters for the Contour tool, click Run and the contours will be generated. The image below shows the generated contour lines overlaid on the pseudocolor DEM.
Contour Styling
We will conduct all of the contour line styling using the Layer Styling panel. If this panel is not open in QGIS by default you can open it from the Main Menu with View > Panels > Layer Styling.
Setting different interval line widths
With contour lines, it is common to make lines at larger intervals wider than lines at narrow intervals. For example, contour lines that are divisible by 200 ft would be thicker than other contour lines. In this example, we will create different widths for contour lines. The widest lines will be divisible by 200, the next widest will be divisible by 100, and all other contour lines will be the default value. We’ll use an expression to specify the variable line widths.
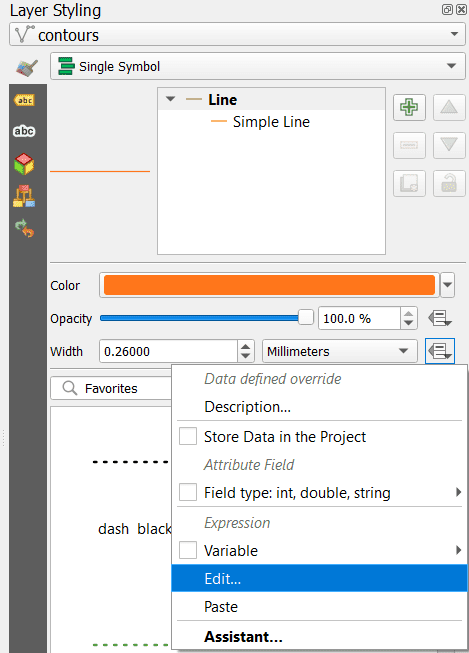
Click on the options button ![]() and select ‘Edit’ (see image below) to edit contour line width with an expression. This will allow us to give different line widths to different contour intervals. For example, contours divisible by 100 can be made thicker than the other contour lines.
and select ‘Edit’ (see image below) to edit contour line width with an expression. This will allow us to give different line widths to different contour intervals. For example, contours divisible by 100 can be made thicker than the other contour lines.
After you click ‘Edit’ a new dialog will appear where you can enter an expression to set line widths. For this example, we will create three different contour line widths. Contour lines divisible by 200 will have a width of 0.6 mm, contours divisible by 100 will have a width of 0.3 mm, and all other contours will be 0.15 mm wide. Once you have written the expression, click ‘OK’ to apply it to your contour lines (you can copy and paste the code block below).
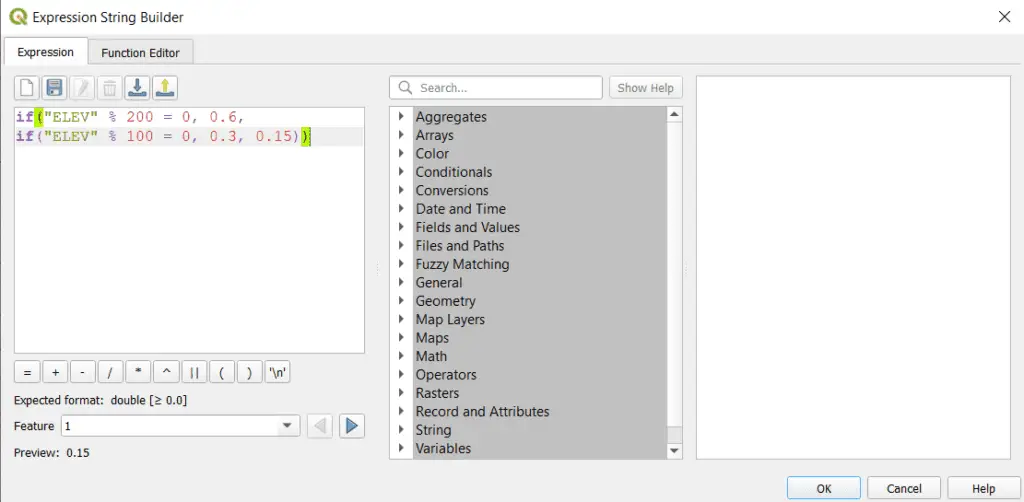
You can copy and paste the code below into the expression editor.
if("ELEV" % 200 = 0, 0.6,
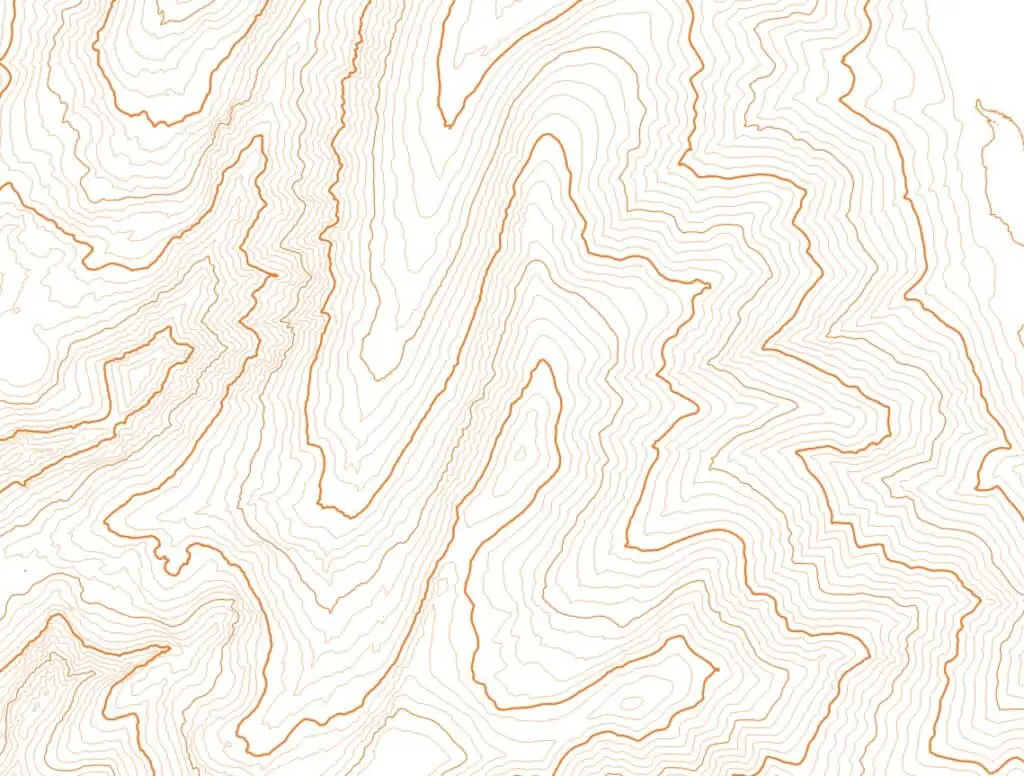
if("ELEV" % 100 = 0, 0.3, 0.15))Once you have applied the expression the contour line widths will be updated. The image below shows the contour lines of three different widths.
Now it’s time to create labels for our contours.
Label Contour Lines
As with contour line styling, we will conduct all the contour labeling and formatting using the Layer Styling panel.
Create contour labels
To create labels for contour lines in QGIS, select the ‘Labels’ tab from the Layer Styling panel and choose ‘Single Labels’ from the drop-down. The ‘Value’ field of the labels tab specifies which column to use for labeling. For now, select the “ELEV” column for the Value. We’ll update this later. You can now change the font, size, color, and style of the labels. My settings are shown below.
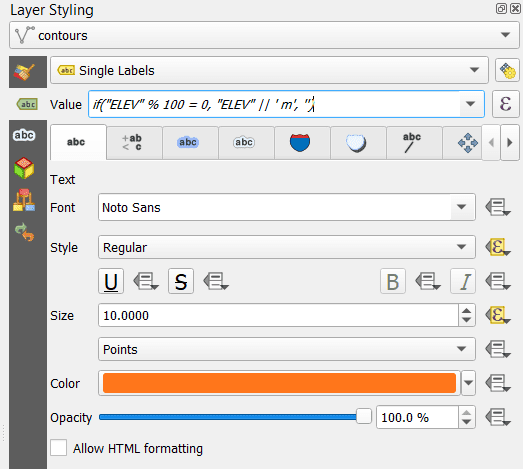
With the current settings, every contour line will be labeled with its elevation. This is much too busy, so we want to label contours at specific intervals. To do this we’ll use an expression.
Follow the same instructions from above to open the expression editor window. Now you can enter an expression to label only contour lines that are evenly divisible by 100. Your expression should look something like this:
if("ELEV" % 100 = 0, "ELEV" || ' m', '')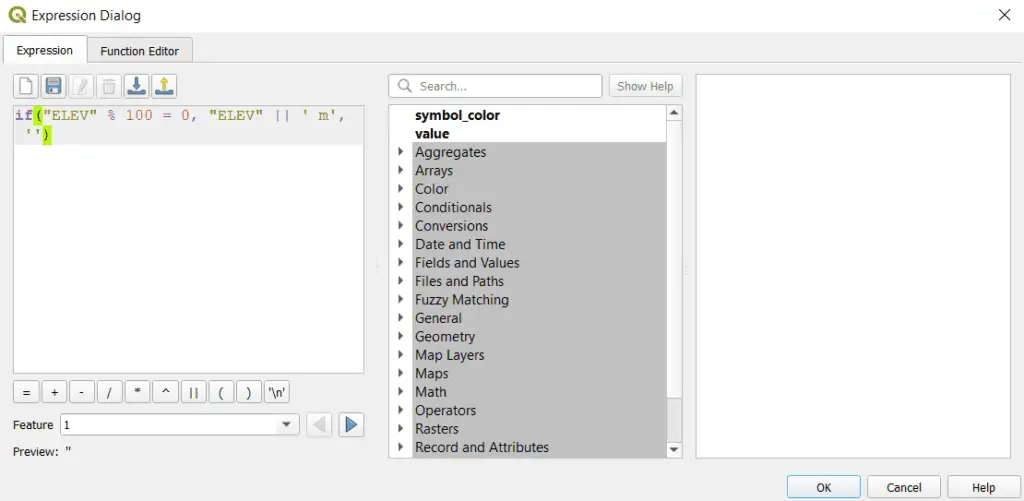
Now let’s use another expression to change the text size and text style to match our contour line formatting. Remember that contour lines evenly divisible by 100 are thicker than other contours, and lines evenly divisible by 200 are thicker than those that are evenly divisible by 100. Let’s make our labels match this by making lines evenly divisible by 200 one size larger and bold.
Use this expression to adjust the label font size.
if("ELEV" % 200 = 0, 11.0, 10.0)And use this expression to adjust the label style.
if("ELEV" % 200 = 0, 'Bold','')Distance between labels
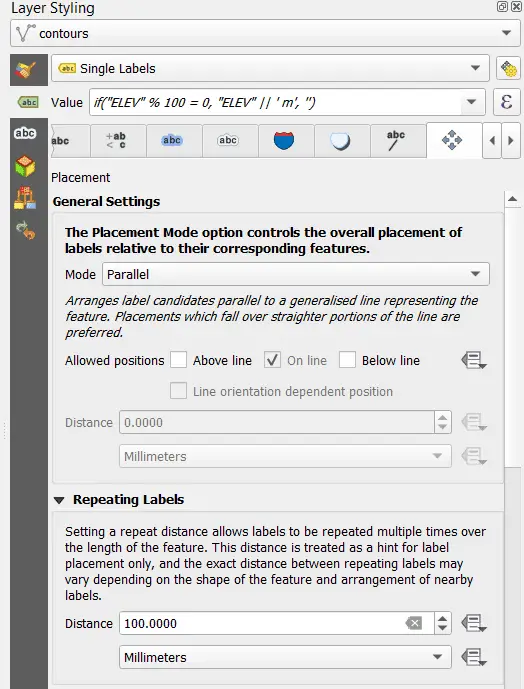
It’s likely that your initial labels will be placed too close together, or too far apart. You can adjust the label spacing on the ‘Placement’ tab of the Labels tab within the Layer Styling panel. In the ‘Repeating Labels’ section change the ‘Distance’ option until the label spacing is appropriate for your application (see image below). I’ve spaced my labels 100 mm apart.
Mask lines behind labels
You’ll notice that the contour lines go right across the labels, which makes the labels difficult to read. We can fix this by putting a mask behind the contour line labels. To mask out the contour lines we need to make two adjustments.
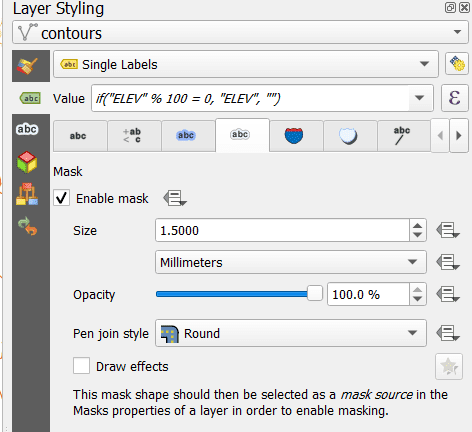
First, from the Labels tab on the Layer Styling panel, select the Mask tab. Now check the ‘Enable mask’ box to allow masking (see image below).
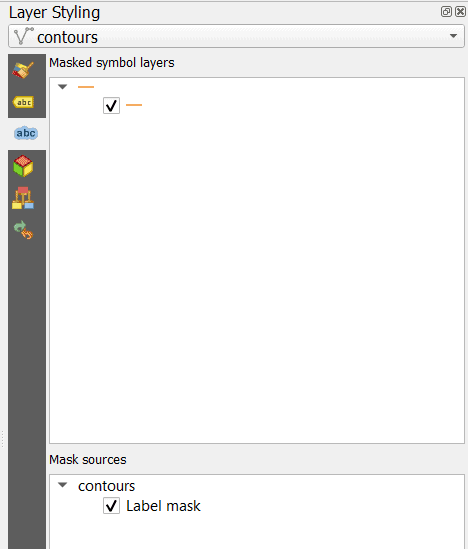
Next, we need to specify which features to mask. Select the ‘Mask’ tab on the Layer Styling panel (this is different from the Mask tab that is on the Labels tab, see image). Check the boxes for the symbol layers and mask sources. You can adjust the mask size on the Mask tab on the Labels tab with the ‘Size’ option. I’ve set my size to 1.5 mm.
Now the contour lines will disappear when they pass behind a label and your labels will be much easier to read.
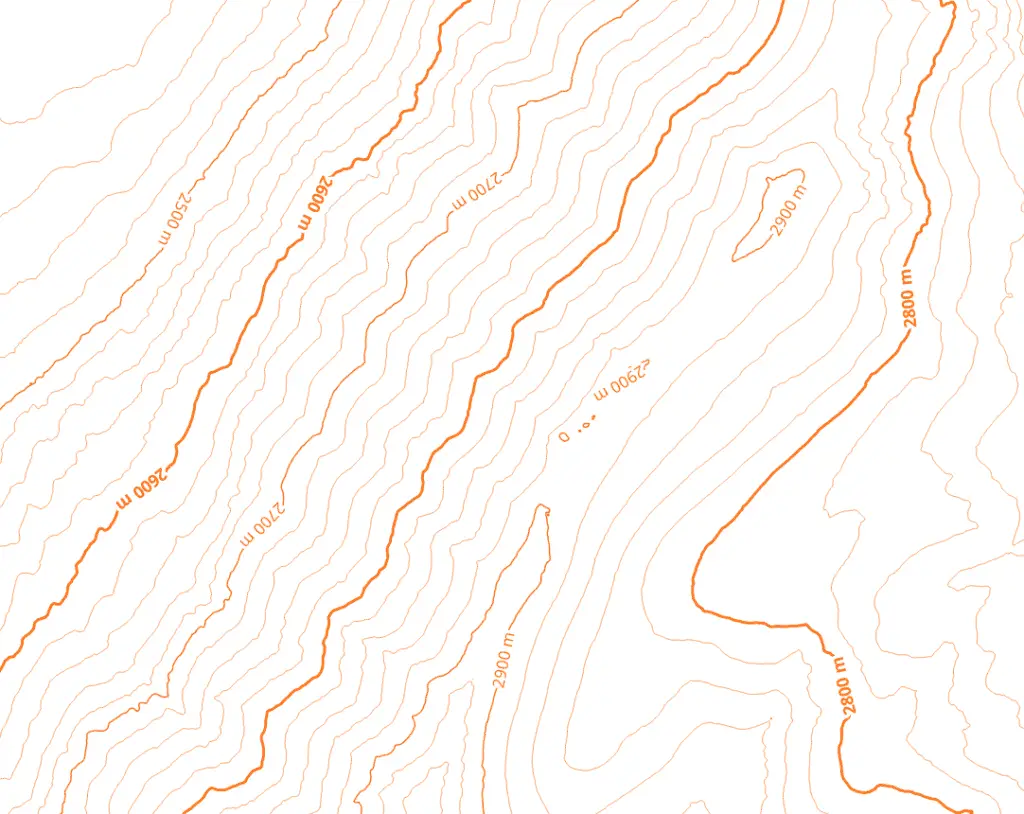
Make contour labels face uphill
Cartographically correct contour labels should face uphill (see images below). It is unlikely that the contour labels you have created will be cartographically correct. In fact, some will probably face uphill and some will probably face downhill. Not to worry. This is quite easy to fix.
The first thing to do when adjusting contour label direction is to test the upside-down label settings on the Rendering tab of the Labels tab (see image below). The default setting for ‘Show upside-down labels is ‘never’. When ‘never’ is selected some of my labels still face downhill. When I select ‘always’ all of my labels face downhill. That’s okay, if all labels are facing the same direction then we can make an adjustment.
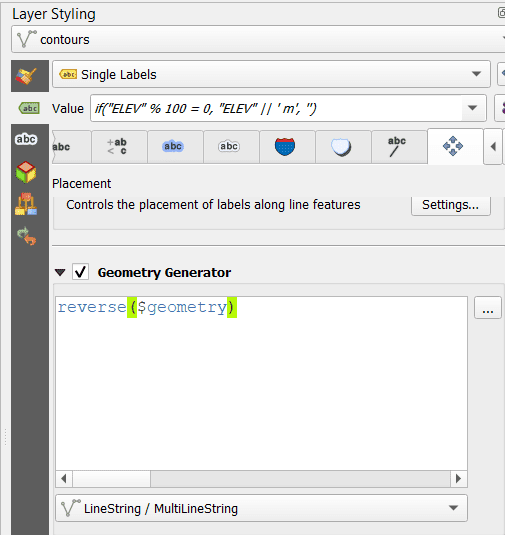
Now that all labels are facing the same direction (even though it’s the wrong direction) I can change the direction of the geometry to flip the labels. Go to the ‘Placement’ tab of the Labels tab. Scroll down to ‘Geometry Generator’ and check the box to turn it on. Make sure to select the proper geometry type from the drop-down below the text box (for contour lines this will be ‘LineString / MultLineString’). Now enter an expression to reverse the geometry.
reverse($geometry)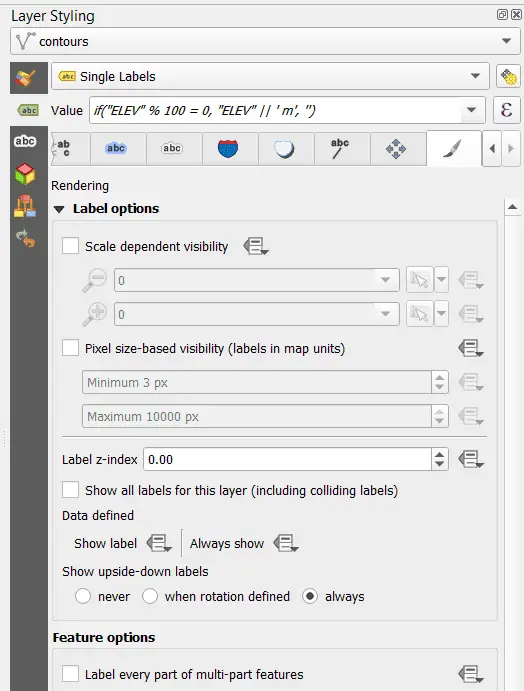
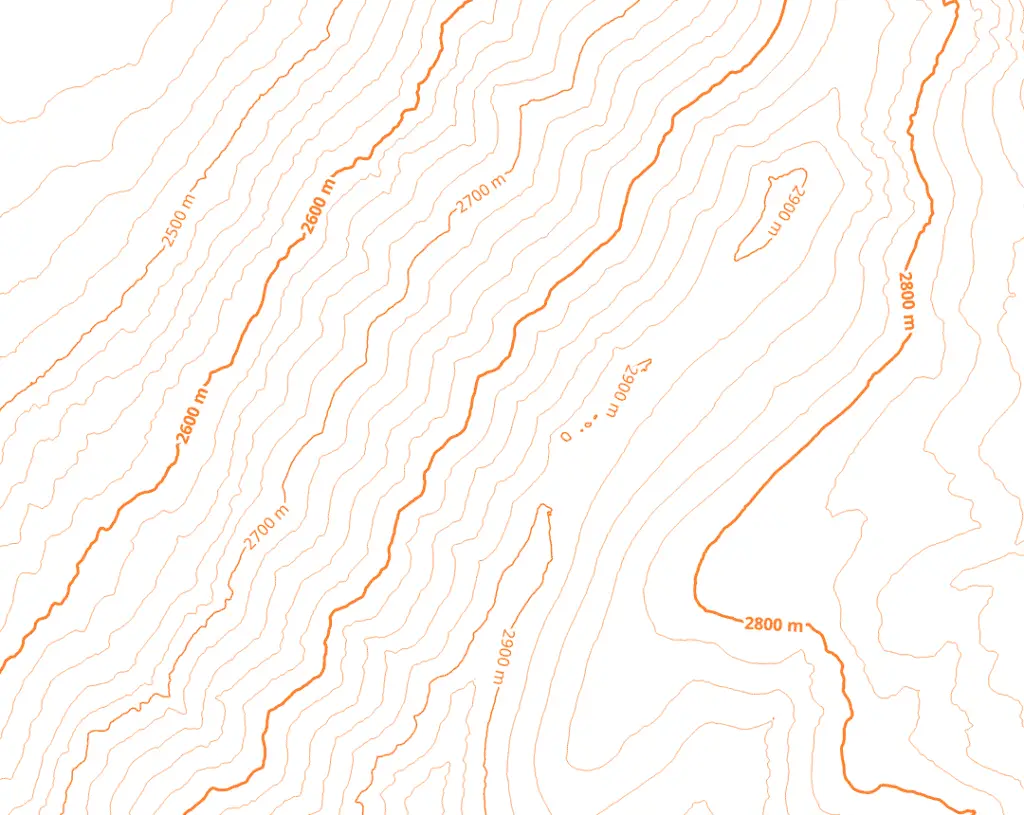
Once the changes are applied your contour lines should all be facing uphill (as shown in the image below).
Conclusion
Contour lines have been used to display topography for hundreds of years, and are still regularly used today. Chances are you will find a need to create a map with contour lines for one of your geospatial projects at some time. This tutorial has covered the basics of contour line creation, labeling, and styling in QGIS while introducing some advanced concepts (like expressions). There are many more styling and labeling options that you can implement to customize your contour lines. Use this tutorial as a starting point and build your skills and styling out from here. Good luck, and feel free to show off any cool maps that you create!
Whether you’re looking to take your GIS skills to the next level, or just getting started with GIS, we have a course for you! We’re constantly creating and curating more courses to help you improve your geospatial skills.

All of our courses are taught by industry professionals and include step-by-step video instruction so you don’t get lost in YouTube videos and blog posts, downloadable data so you can reproduce everything the instructor does, and code you can copy so you can avoid repetitive typing