
Intro to NetCDF with Python (netCDF4)
Many geographic data are store in netCDF format. This is especially true for climate data. Interacting with netCDF data files is an important skill for any geographer, physical scientist or data scientist to have. This tutorial will get you started using the netCDF4 Python package to read netCDF data.
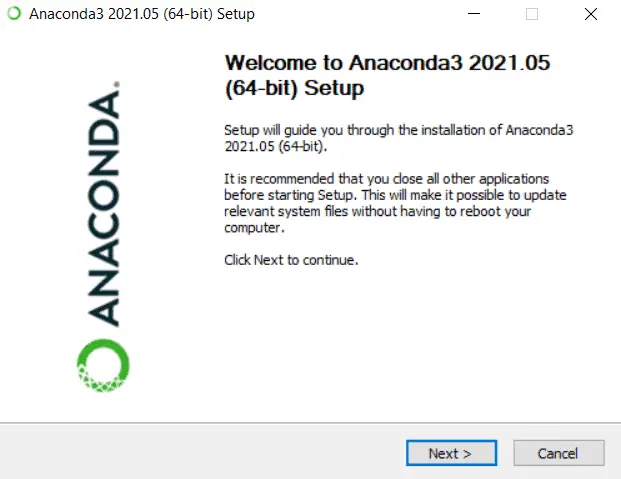
First, you’ll need to install netCDF4. Depending on your Python setup this may be very easy or quite complicated. For simplicity, I recommend using Anaconda for the installation. In the Anaconda prompt simply type:
conda install netcdf4
Then follow the prompts to install the package.
Now, open PyCharm (or another IDE, or a Python console) and import netCDF4. You should be able to run the import without any problems.
import netCDF4 as nc
Once you’ve confirmed that you can import netCDF4 define a variable with a path to a netCDF file
fn = 'C:/path/to/file.nc4' # path to netcdf file
Then read the file as a netCDF dataset.
ds = nc.Dataset(fn) # read as netcdf dataset
If you print the dataset you should get information that looks similar to the following. It will describe the source of the data and the variables represented by the data.
<class 'netCDF4._netCDF4.Dataset'>
root group (NETCDF4_CLASSIC data model, file format HDF5):
    start_year: 1980
    source: Daymet Software Version 3.0
    Version_software: Daymet Software Version 3.0
    Version_data: Daymet Data Version 3.0
    Conventions: CF-1.6
    citation: Please see http://daymet.ornl.gov/ for current Daymet data citation information
    references: Please see http://daymet.ornl.gov/ for current information on Daymet references
    dimensions(sizes): time(1), nv(2), y(8075), x(7814)
    variables(dimensions): float32 time_bnds(time,nv), int16 lambert_conformal_conic(), float32 lat(y,x), float32 lon(y,x), float32 prcp(time,y,x), float32 time(time), float32 x(x), float32 y(y)
    groups:
You can show information for a specific variable as follows. This shows information for the ‘prcp’ (precipitation) variable.
ds['prcp']
<class 'netCDF4._netCDF4.Variable'>
float32 prcp(time, y, x)
    _FillValue: -9999.0
    coordinates: lat lon
    grid_mapping: lambert_conformal_conic
    missing_value: -9999.0
    cell_methods: area: mean time: sum within days time: sum over days
    units: mm
    long_name: annual total precipitation
unlimited dimensions: time
current shape = (1, 8075, 7814)
Data from a variable are accessed in the same way you would access data in a numpy array. So, to get all the data for the ‘prcp’ variable, we use the following code.
prcp = ds['prcp'][:] # get data for variable
Now, print out a small slice of the data to see what the precipitation values are.
print(prcp[0, 4000:4005, 4000:4005]) # print slice of data
[[341.0 347.0 336.0 329.0 353.0]
 [336.0 339.0 341.0 332.0 349.0]
 [337.0 340.0 334.0 336.0 348.0]
 [342.0 344.0 332.0 338.0 350.0]
 [350.0 351.0 342.0 346.0 348.0]]
The video below gives a step-by-step demonstration of accessing data in a netCDF.


One Comment
Comments are closed.