QGIS: Create Points from Excel or CSV
When working with spatial data it is common to have a file that has columns containing coordinates and attributes. Often points are represented in Excel or CSV (comma-separated values) files. To work with these data with geospatial software (like QGIS or ArcGIS) they need to be converted to a geospatial file format, like a geopackage or shapefile. This tutorial will demonstrate how to use QGIS to create points from an Excel or CSV file, or another tabular file format.
About the Data
For this exercise, I am using data from five of the world’s cities. You will need to have these data in CSV format (or as a delimited text file) to load them into QGIS. I find CSV files to be the easiest data format to work with in QGIS. If you are using Excel, simply use ‘Save As’ to save the sheet of interest as a CSV file. These data are tabular, which means they are formatted into columns. You can copy the table below to work with the same data I am using.
A CSV file is a delimited text file where each line represents a row of data and within each row, the column values are separated by commas.
| ID | Name | Lon | Lat | Population |
|---|---|---|---|---|
| 1 | San Diego | -117.1572 | 32.707 | 1415000 |
| 2 | London | -0.1027 | 51.500 | 8982000 |
| 3 | Tokyo | 139.7800 | 35.678 | 13960000 |
| 4 | Mumbai | 72.8819 | 19.069 | 20961000 |
| 5 | Cape Town | 18.4353 | -33.923 | 4618000 |
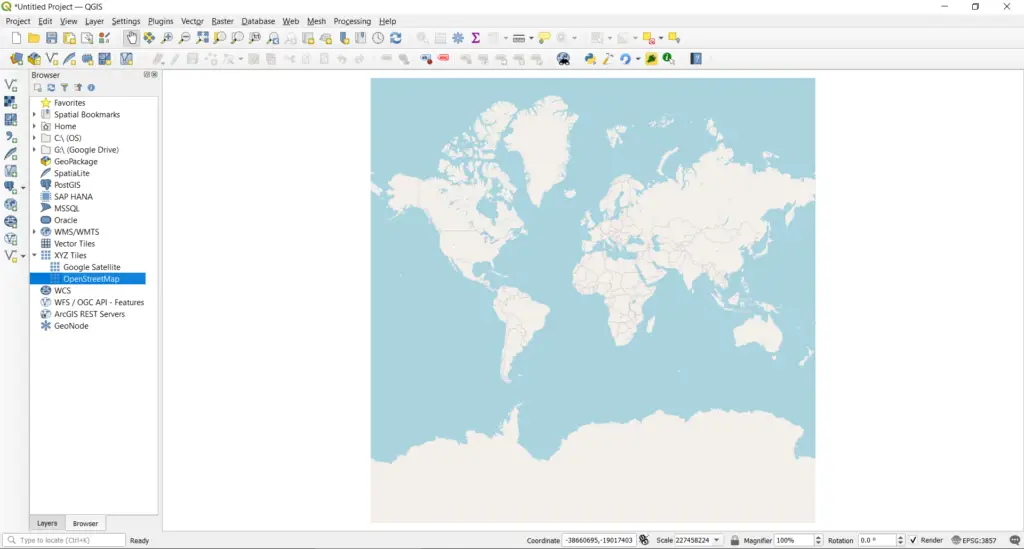
Open QGIS and Add a Basemap
To begin, open QGIS and add a basemap. I am using the QGIS default OpenStreetMap basemap. The basemap will provide context to make sure the points are occurring in the correct locations.
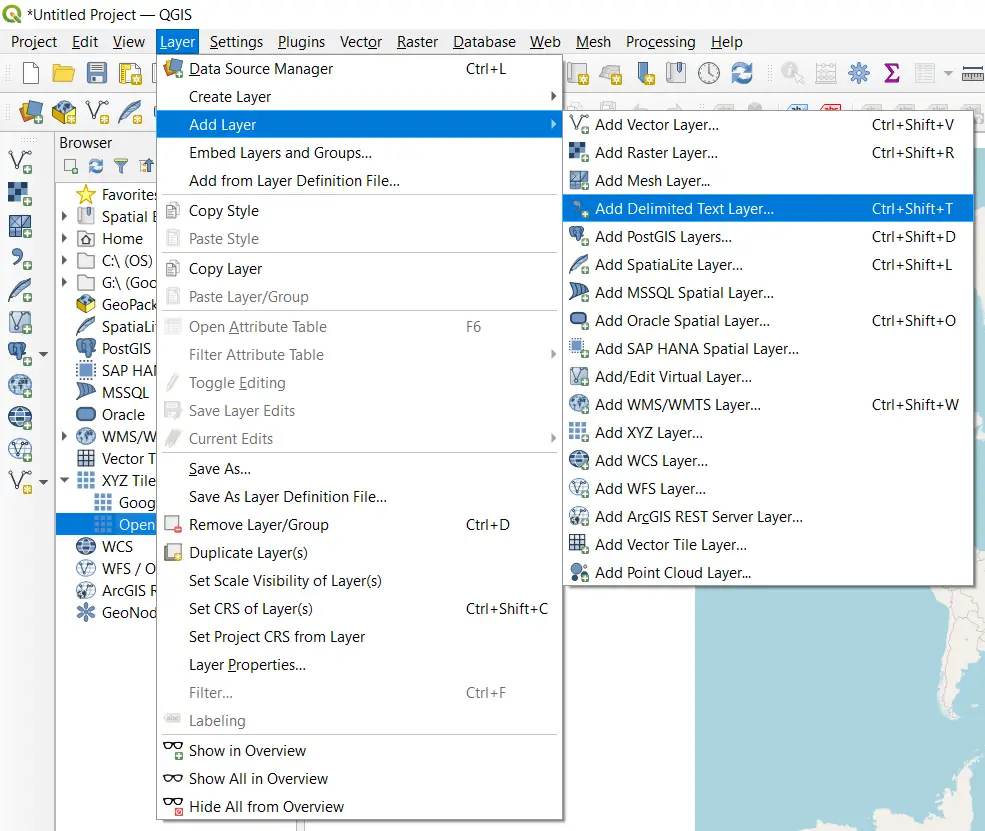
Add a Delimited Text File to QGIS
Now add your CSV file to QGIS. To add a CSV file to QGIS, select Layer > Add Layer > Add Delimited Text Layer from the Main Menu. You can also select the Add Delimited Text Layer button ![]() from an open toolbar.
from an open toolbar.
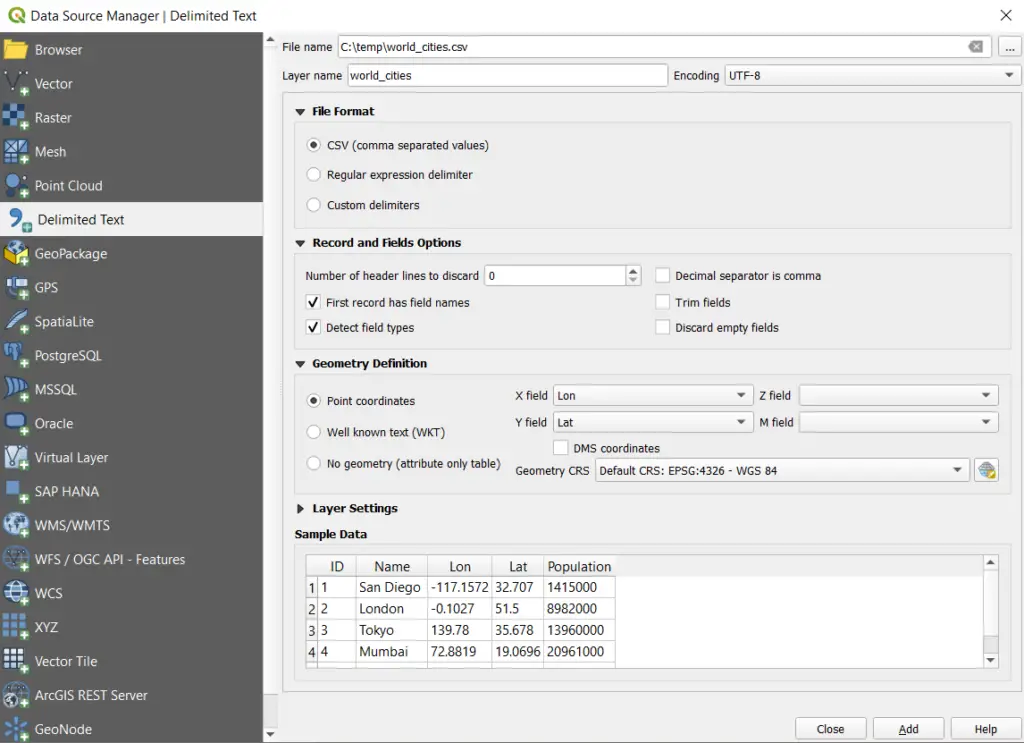
Once you have selected Add Delimited Text Layer, a new window will open. In this window, select the CSV file you wish to upload.
Under the ‘File Format’ section, select ‘CSV (comma separated values)’ or change the setting to match your specific file.
Set the ‘Records and Fields Options’ to match the specifics of your file. The default values will be adequate if you are using the data from the table above.
A sample of the data will appear at the bottom of the window so you can ensure you’ve applied the proper settings.
The ‘Geometry Definition’ section is where we will tell QGIS how to display the geographic coordinates in the file. Select ‘Point coordinates’. Now specify the columns from the CSV file that give the X and Y values for ‘X field’ and ‘Y field’. Longitude (Lon) is the X value and latitude (Lat) is the Y value.
Be sure the Geometry CRS is appropriate for the coordinate. The coordinates used here are geographic (in decimal degrees) so any geographic coordinate system will suffice. If your points are in a projected CRS make sure to select the correct one.
If ‘No geometry’ is selected, only the table will be loaded into QGIS and no geographic data (i.e., points) will be displayed.
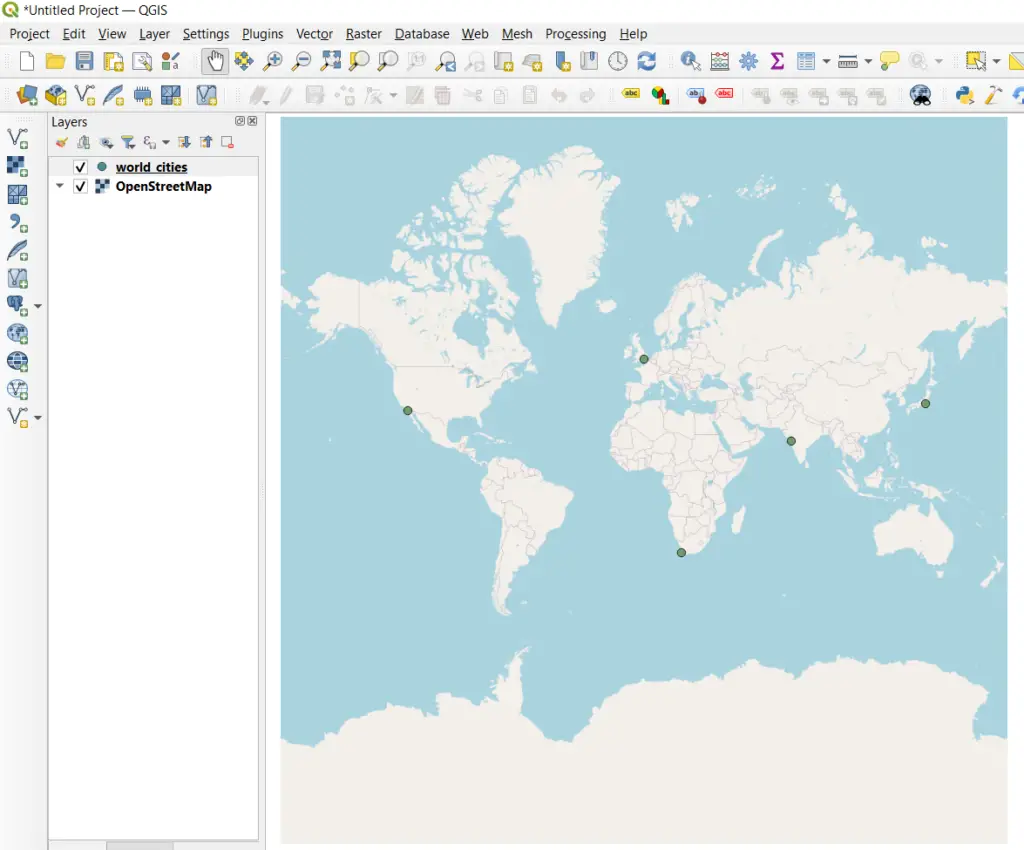
Now you can click ‘Add’ and the points will be displayed in the QGIS map canvas.
Now the points will appear in their appropriate locations on the map.
Save/Export CSV Points in a Geographic File Format
The points we have created are only displayed in QGIS. Once we exit QGIS the points will disappear and we’ll have to go through the same process to display them again. The points displayed from the CSV can be exported to a geospatial file format so that the geographic information is saved and will automatically be displayed in geospatial programs, like QGIS.
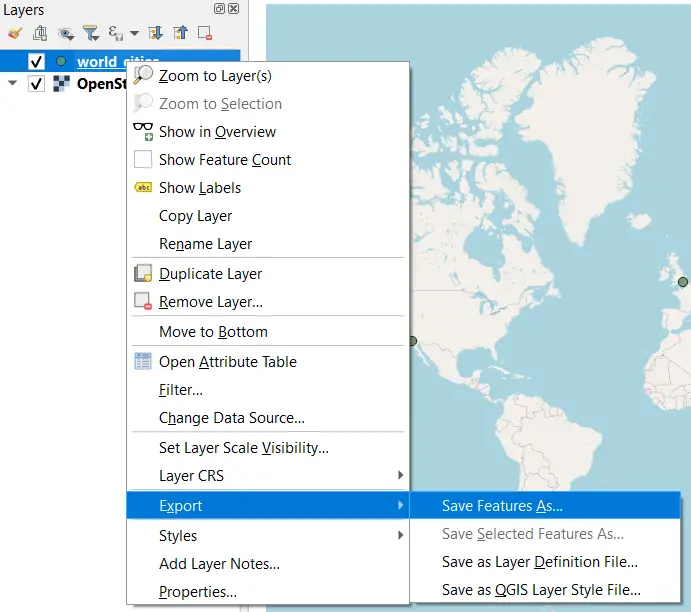
To export the points to a geographic file (here will use GeoPackage), right-click on the layer name (world_cities) in the Table of Contents and select Export > Save Features As. This will open a new window where you can select options for the file export.
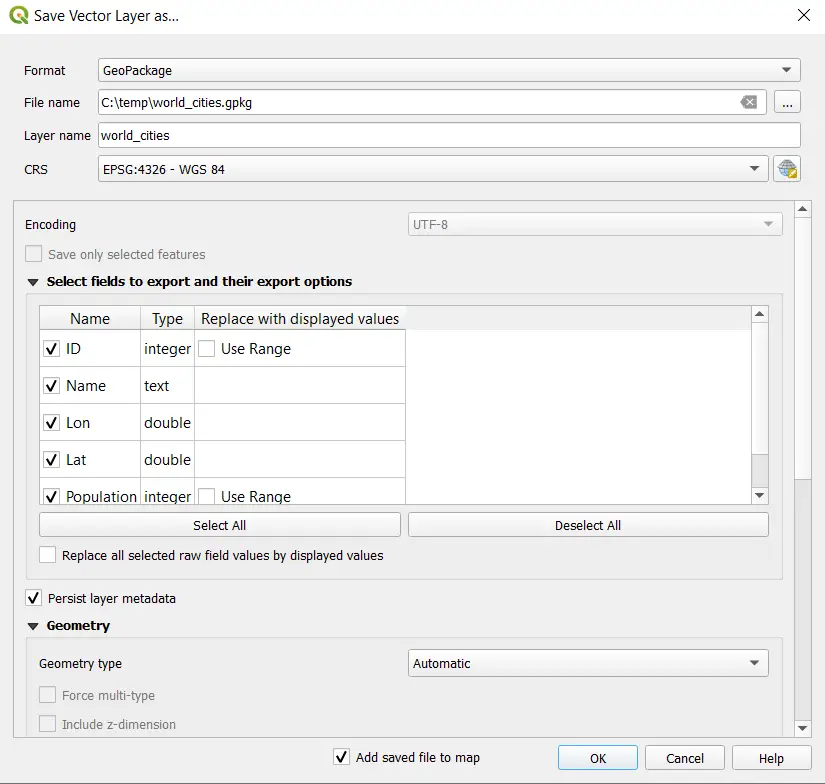
In the Save Vector Layer as window select the file format you wish to export (I am exporting to the GeoPackage format) and select an output file name and location. Ensure the CRS is correct and select the fields you wish to export. When you have the settings specified, click OK to export the file.
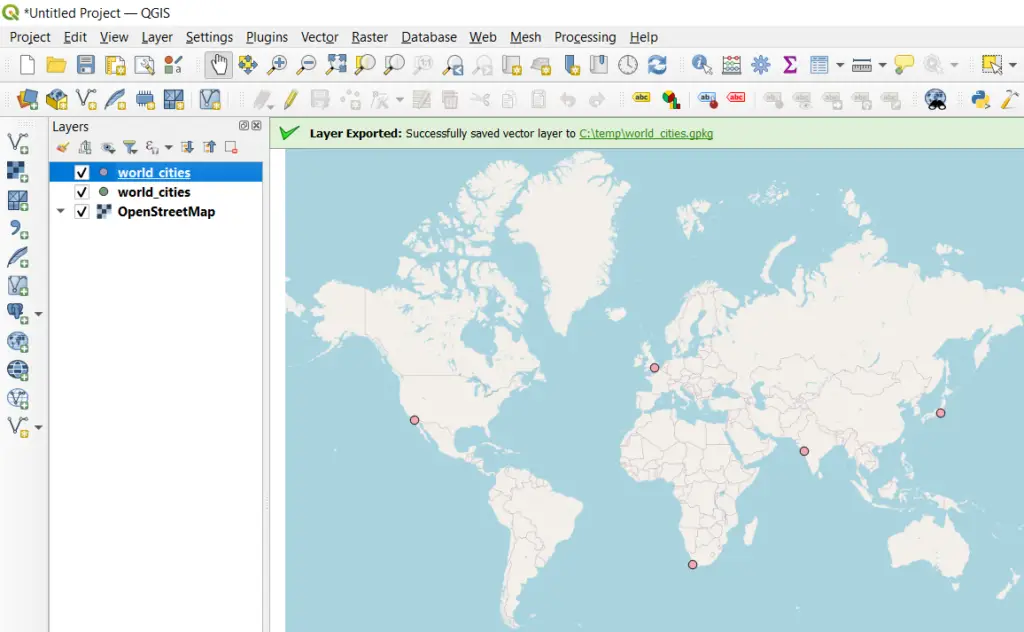
Now when you add the exported GeoPackage file to QGIS, the geometry (i.e., points) will display automatically, as shown in the image below.
Conclusion
This tutorial demonstrated how to display geographic points in QGIS from an Excel file or CSV file and how to save the resulting points in a geographic format for future use. This is a task that you will likely perform regularly when performing GIS analysis. For a full, step-by-step introduction to QGIS check out my QGIS course, complete with data and video tutorials.