QGIS Python Tutorial (PyQGIS Tutorial)
If you’re looking for a way to automate your GIS workflows and products, the QGIS Python API (PyQGIS) may be able to save you a lot of time. With PyQGIS you can write Python code that automates QGIS tasks that range from loading data to creating and saving map layouts.
I’ve used PyQGIS to write Python scripts that automate time-consuming tasks, and that keep all my map layouts consistent, even when I need to change the input data. Doing this has been a huge time saver when I need to perform the same analysis and generate the same outputs for new projects or data updates.
This article will get you started with the basics of QGIS. I can’t cover everything in this short tutorial, but for those that are interested in more in-depth material, I have a full course on this topic that includes code, data, and more than 8 hours of video instruction.
QGIS Python Console and Code Editor
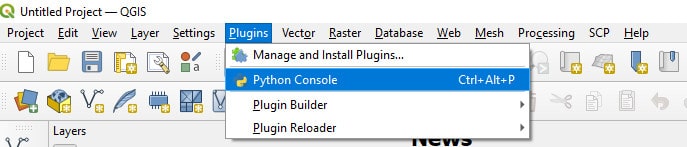
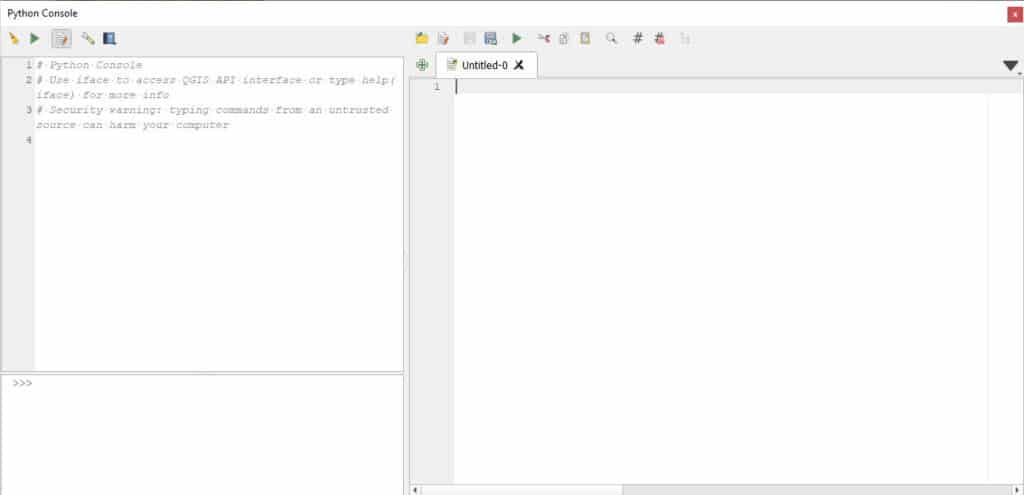
To start, open the QGIS Python Console from Plugins > Python Console. Note that this is the easiest way to write Python code for QGIS because it will automatically use the QGIS Python installation and you won’t have to worry about setting up environments, installing packages, or ensuring compatibility.
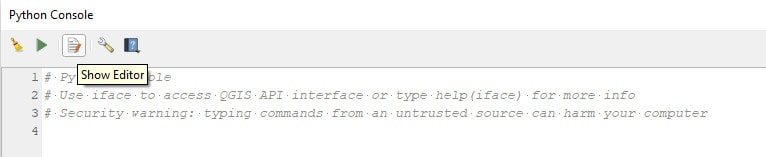
You should now have the Python console open. You can type and run Python commands in this console next the >>> symbol. You can also click the Show Editor button (shown in the image below) to open up a code editor that makes it easier to write out reproducible scripts.
In addition to the code editor (shown below) you can write code in an IDE of your choosing and run the code from the QGIS Python console. Usually, I find it easiest to do all of my development in QGIS, but you may find a different workflow works better for you.
Add a Vector Layer
To add a vector layer to the QGIS interface using the Python console, use iface.addVectorLayer(). iface references the QGIS interface and addVectorLayer() is a function to add a vector layer to the interface (pretty self-explanatory). Three arguments must be passed to addVectorLayer(): the file path of a vector file, a layer name (can be blank), and a provide (I always use ogr).
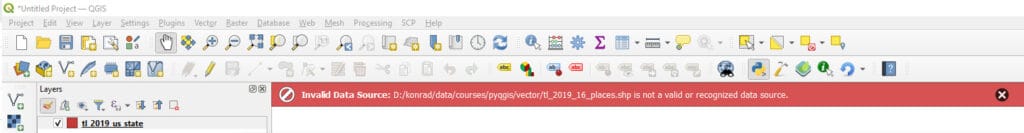
Once these three arguments are specified you can click the run button above the text editor to run the code. If you’ve specified everything correctly a layer will be added to QGIS, otherwise, you will receive an error message.
The following code adds two vector layers to the QGIS interface, a shapefile of states and a shapefile of places. Notice that I have left the layer name argument blank (empty quotes: ''). When this is done, the layer name will be the file name.
fn_states = 'D:/konrad/data/courses/pyqgis/vector/tl_2019_us_state.shp'
fn_places = 'D:/konrad/data/courses/pyqgis/vector/tl_2019_16_place.shp'
iface.addVectorLayer(fn_places, '', 'ogr')
iface.addVectorLayer(fn_states, '', 'ogr')
Here you can see that I received an error because the file I specified did not exist.
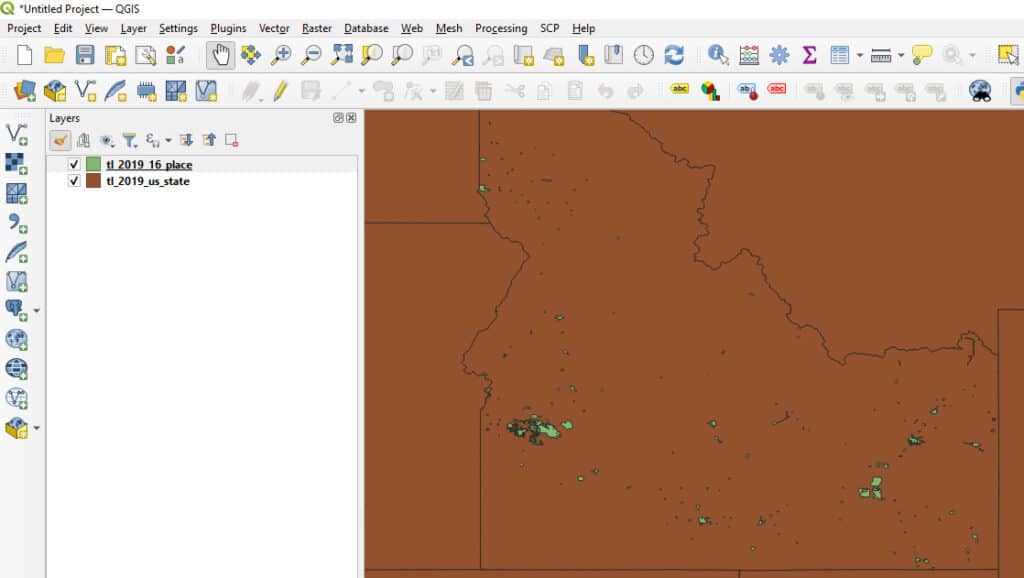
Once the file name was corrected both layers were properly added to the interface as shown below.
When you load a layer to the QGIS interface you can also save it as a variable (see code below). This will allow you to access the layer later in your script to get more information about the layer and/or edit its attributes and geometries.
In the code below I’ve saved the layers to the variables lyr_places and lyr_states.
fn_states = 'D:/konrad/data/courses/pyqgis/vector/tl_2019_us_state.shp'
fn_places = 'D:/konrad/data/courses/pyqgis/vector/tl_2019_16_place.shp'
lyr_states = iface.addVectorLayer(fn_states, '', 'ogr')
lyr_places = iface.addVectorLayer(fn_places, '', 'ogr')
Get Layer Fields and File Path
Now let’s work with the states layer (lyr_states) to get some information. First, we’ll get the path of the shapefile, and second, we’ll print out information about each of the fields/columns in the attribute table.
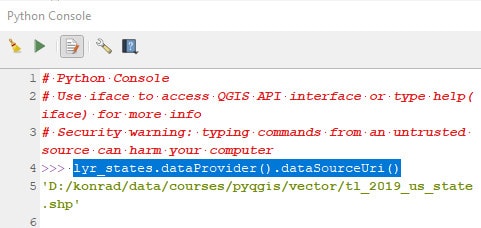
Getting the file path is simple. We just call dataProvider().dataSourceUri() on lyr_states as shown in the code below. You can add this code to the script, or type it into the console (that’s what I’ve done here). If you add it to the script, remove the existing layers from the QGIS interface before you run the code or you will have duplicate layers. This is not a problem, just an inconvenience.
lyr_states.dataProvider().dataSourceUri()
No matter how you run the code, you should see output similar to the image below in the console panel that displays the file path.
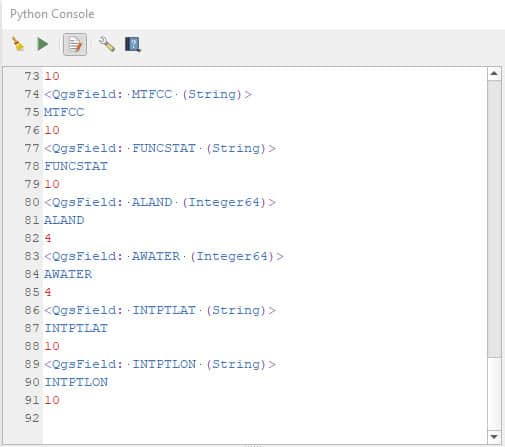
Now let’s write some code to print out information about each field. The fields of a layer can be accessed by calling .fields(). This returns a QgsFields objects, which is basically an iterable of individual fields. We’ll loop through each field and print out its definition, name, and type. The code below demonstrates how to do this.
for field in lyr_states.fields():
    print(field)
    print(field.name())
    print(field.type())
All the fields for the particular layer are strings, the type gives the length of the string (number of characters) reserved for each field. You can see the partial output from my console in the image below.
You can use Python to add fields and edit attribute values. There’s not room to cover all of those operations in this introductory tutorial, but these topics are covered in the full course.
Create a New Feature
With PyQGIS we can also edit features and add new features to existing layers. For this example, I’m going to add a feature to an existing layer. To do this I’m first going to open a layer that I want to edit. The layer I’m editing is a copy of a roads layer for the state of Idaho. Notice that I’m using QgsVectorLayer() to load a vector layer without adding it to the map.
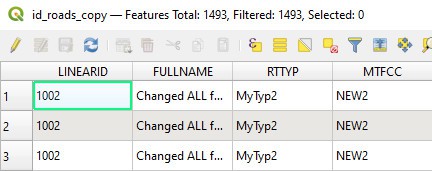
Next, create a new feature (QgsFeature) with the same fields as the layer we want to add it to. Then set the attribute values (.setAttributes()) for the fields. The image below shows the first few rows of the layer attribute table (all the code is in the block at the end of this section). Notice there are four fields and 1493 features.
Once the attributes are set we need to create the geometry for the feature. The roads layer is made up of lines so we’ll create a QgsGeometry from a polyline, which is just a list of points. These points are defined as QgsPoint().
Now we can set the geometry of the new feature and, finally, add the new feature to the layer. The code block below shows the specifics of how this is done.
fn_roads = 'D:/konrad/data/courses/pyqgis/vector/id_roads_copy.shp'
lyr_roads = iface.addVectorLayer(fn_states, '', 'ogr')

newfeat = QgsFeature(lyr_roads.fields())
newfeat.setAttributes(['1005', 'added new feature', 'zz', 'zzz'])
geom = QgsGeometry.fromPolyline([QgsPoint(-117.0, 40.0), QgsPoint(-110.0, 40.0)])
newfeat.setGeometry(geom)
lyr_roads.dataProvider().addFeatures([newfeat])
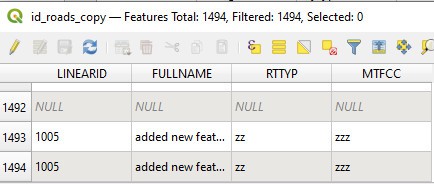
Notice that the layer now has 1494 features (the original 1493 plus the one we added) and that there is a feature containing the attributes we specified.
Add a Raster Layer
Adding a raster layer to the QGIS interface is done in almost the same way as adding a vector layer. The main difference is that you’ll use iface.addRasterLayer() or QgsRasterLayer() instead of the vector counterparts. With raster layers, you only need to specify the file name. You do not need to specify the data provider. As with vector layers, a layer name can be specified but is not required.
It’s easy to access basic raster properties. The code block below demonstrates how to load a raster layer (with and without adding it to the interface) and how to access the number of rows (height), columns (width), and bands.
fn = 'D:/konrad/data/courses/pyqgis/raster/USGS_NED_13_n45w116_IMG.img'

# load layer and add to interface
lyr = iface.addRasterLayer(fn)

# load layer without adding to interface
lyr = QgsRasterLayer(fn)

# print some raster properties
print('height', lyr.height())
print('width', lyr.width())
print('bands', lyr.bandCount())
Your output in the QGIS Python console should be similar to the image below.
Get Raster Data
Often, processing a raster requires us to retrieve the array that contains the actual data values. We can easily do this in QGIS using the gdal library. Instead of adding loading the raster as a QGIS raster type, well open the raster as a GDAL dataset. Then we can get the data from a raster band as a numpy array. Once we have the array we can use indexing to get values at specific locations. The code block below demonstrates how this is done.
Note that you’ll need to import the gdal library. All of the osgeo libraries are part of the QGIS Python installation, so you won’t need to do any installs, just make sure you import it. If you’re using an older version of QGIS and get an import error try changing from osgeo import gdal to import gdal.
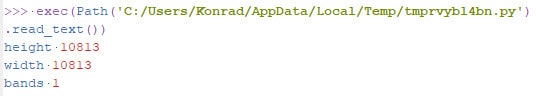
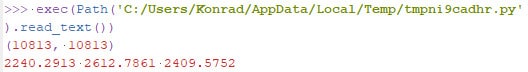
from osgeo import gdal

fn = 'D:/konrad/data/courses/pyqgis/raster/USGS_NED_13_n45w116_IMG.img'
ds = gdal.Open(fn)
data = ds.GetRasterBand(1).ReadAsArray()
print(data.shape)
print(data[0,0], data[10812, 10812], data[5400, 5400])
After running the code, you should see output in the console similar to the image below.
More You Can Do with PyQGIS
My Python Scripting with QGIS course contains over 8 hours of video instruction demonstrating how to automate QGIS with Python and provides all the code and data to follow along with the videos. It is the most complete resource for learning to use Python with QGIS and demonstrates how to work with vector, raster, and tabular data using PyQGIS.
More of my free resources, including code, are available from the articles linked below.
- Create a shapefile
- Create a shapefile from selected features
- Clip vector layers
- Buffer features/geometries
- Dissolve vector features
- Calculate geometry (length/area) and field values
- Measure the distance between features/geometries
- Spatial joins
- Create and print a map layout
Conclusion
QGIS is a powerful software, and GIS analysis is a powerful tool for answering important questions. However, one problem with using QGIS for GIS analysis is making workflows repeatable and limiting the number of tools that a user needs to run over and over again. Using PyQGIS (the QGIS Python API) make it possible to create scripts that ensure your workflows are repeatable. This can save you time and reduce the number of errors made while performing tasks. PyQGIS is easy to learn and hopefully, this article has helped you get on your way to automating your GIS tasks using Python and QGIS.