Remote Sensing with QGIS: Calculate NDVI
Vegetation indices are a staple remote sensing product and the normalized difference vegetation index (NDVI) may be the most widely used vegetation index. To calculate NDVI you simply need appropriate imagery and a program that allows you to interact with the image data. QGIS is a great, free option for a GIS program that provides the tools to display, analyze and present remotely-sensed data.
It is very easy to calculate NDVI in QGIS using the QGIS raster calculator. All you need is imagery that contains red and near-infrared bands and QGIS installed on your machine. Both of these things can be obtained completely free.
What is NDVI and Why is it Used?
NDVI measures the ratio of the reflective difference in the red and near-infrared portions of the spectrum to the sum of red and near-infrared reflectance. Green, healthy vegetation reflects light in the near-infrared portion of the spectrum and absorbs red light. NDVI ranges from values of 1.0 to -1.0 where larger, positive values indicate green vegetation.
NDVI is used in many different applications. Specifically, it is an important indicator of the amount and quality of forage for wildlife and livestock. NDVI is also used to assess agricultural fields and identify the location and extent of surface water.
The NDVI Equation
[latexpage] \[\frac{NIR – Red}{NIR + Red}\]
How to Calculate NDVI in QGIS
To calculate NDVI in QGIS, use the raster calculator to subtract values of the Red band from the Near-infrared (NIR) band, then divide by the sum of the Red and NIR bands. All you need is reflectance values in the Red and NIR bands from any kind of imagery and an installation of QGIS. The rest of this article will walk you through how to do this calculation with Landsat 8 imagery. You can also watch the video at the end of the article for a demonstration.
Download Landsat Satellite Imagery
Before you can get started you’ll need to have some data. If you’re not sure how to obtain Landsat data, the video below will walk you through how to download Landsat Analysis Ready Data (ARD) for free.
Add Landsat Data to QGIS
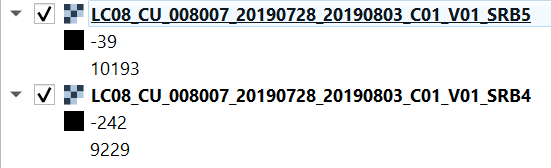
Once you have data for the calculation add the Red and NIR bands to QGIS. For Landsat 8, Red is Band 4 and NIR is Band 5. You can check the Landsat website for descriptions of the spectral ranges for each band.
The image below shows the QGIS Layers panel with bands 4 and 5 from Landsat ARD added to the QGIS project.
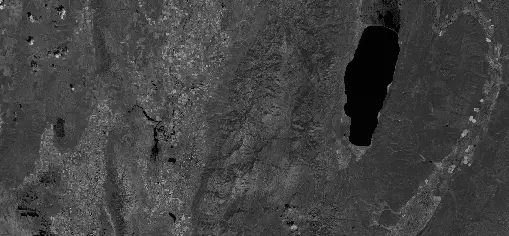
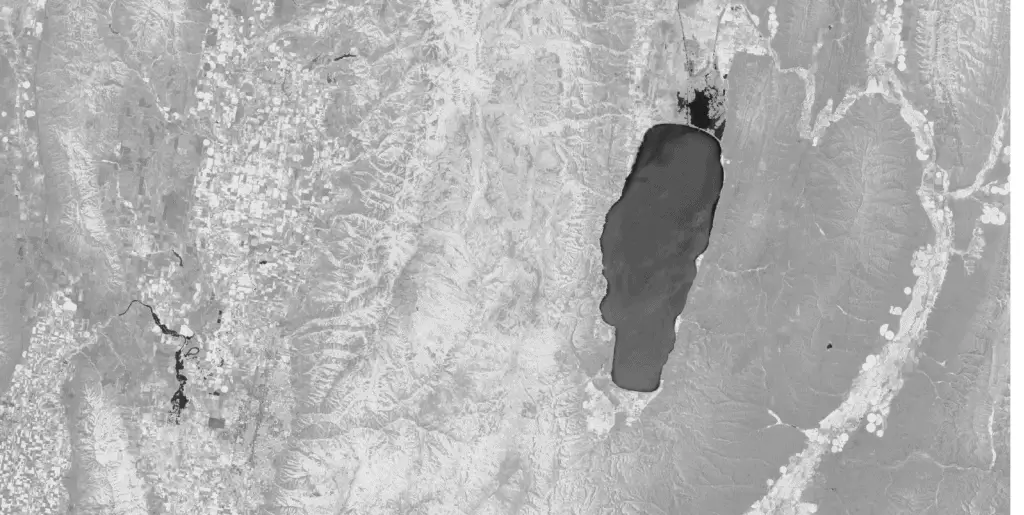
Each Landsat band contains just one value per pixel, so by default the data will be displayed in grayscale (as shown below). If you are using a different data source that stores the data as multiple bands you may see a true color image. That is also okay, you’ll still need to know which bands are Red and NIR.
Calculate NDVI with the Raster Calculator
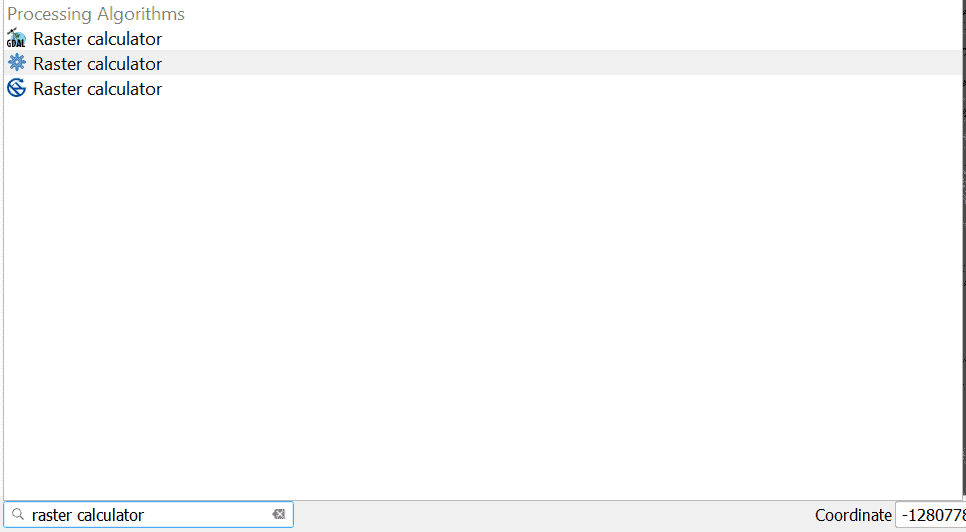
Open the QGIS Raster Calculator. The easiest way to find the Raster Calculator is to search for it in the lower left corner of the QGIS interface (see image below). You may see multiple raster calculator options. QGIS, GDAL, and SAGA all have raster calculators that are available in QGIS. For this tutorial will will use the QGIS raster calculator. It is the one represented by the gear wheel (highlighted in grey in the image below). You can also access the QGIS Raster Calculator from the Processing panel.
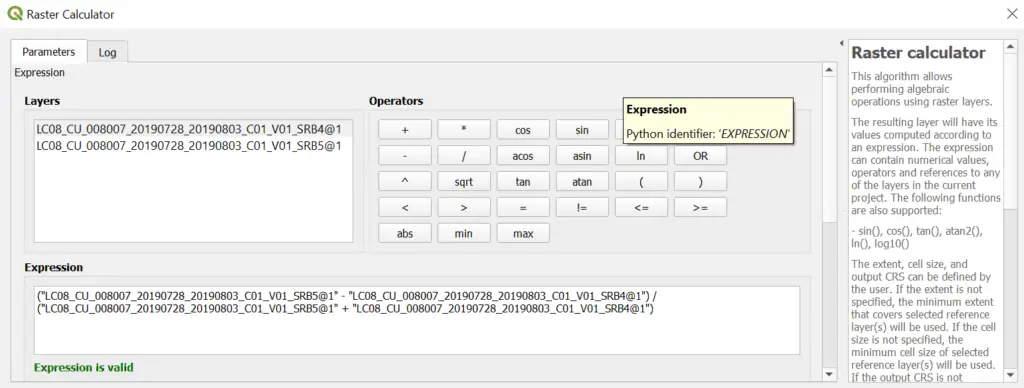
In the raster calculator interface you will see a box on the left (labeled ‘Layers’)that shows all the raster layers displayed in QGIS. The name of each raster layer will be followed by the ‘@’ symbol and a number. The number is the band for that raster layer. In this example, each raster layer only has a single band (band number 1). If you are using different data you may see the same file name entered each time with a different number at the end representing each individual band for that layer.
The white box titled ‘Expression’ is where we will enter the NDVI formula. Double-click on a raster band in the ‘Layers’ box to add it to the expression. You can click on the operator buttons to add them to the expression or enter them using the keyboard. Remember to use parentheses to force the proper order of operations.
When complete your expression should look similar to this (replacing the division symbol with a backslash, ‘\’):
[latexpage]\[(NIRband – Redband) \div (NIRband + Redband)\]
Remember that you will substitute ‘NIRband’ and ‘Redband’ with the appropriate layer and band combination for your particular data source. The image below shows the expression with Landsat 8 data (though it is difficult to see).
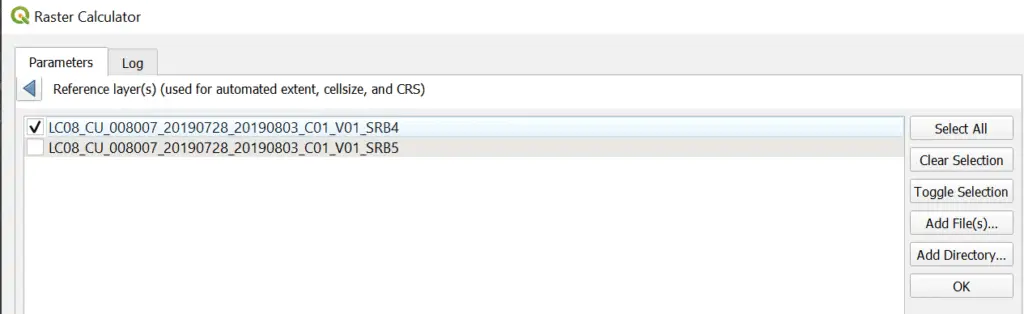
There is one more important setting we need to address to ensure the output layer is concurrent (lines up) with the input layers. Select the ellipsis (. . .) for the Reference layer(s) option. Then check either one one of the layers used to calculate NDVI (see image below). This will set the CRS (projection), cell size, and extent from the selected layer. This means that the raster calculator result will line up with the layer you select here.
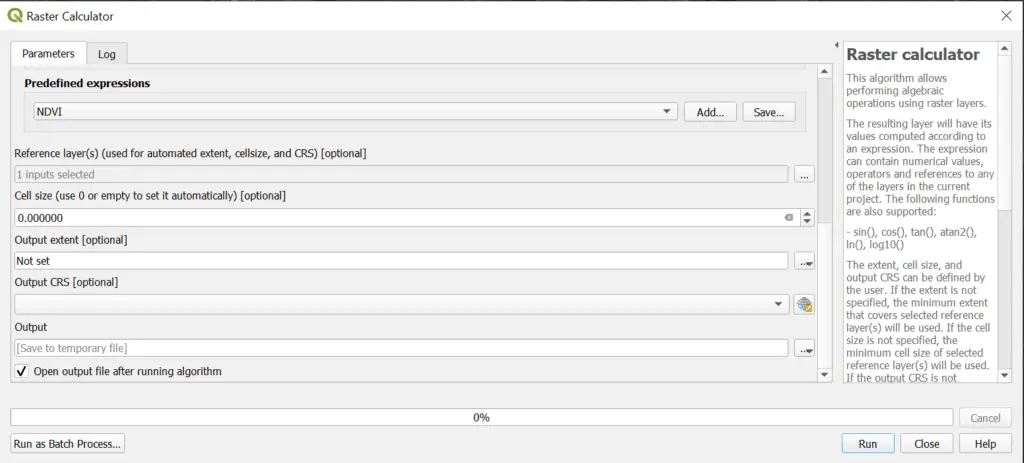
You’ll notice that the ‘Predefined expression’ might be set to NDVI. Don’t worry about this. Raster calculator is using the expression you entered for the calculation. It’s just a coincidence that NDVI is the default predefined expression.
Now you just need to select an output option and file name, then click ‘Run’.
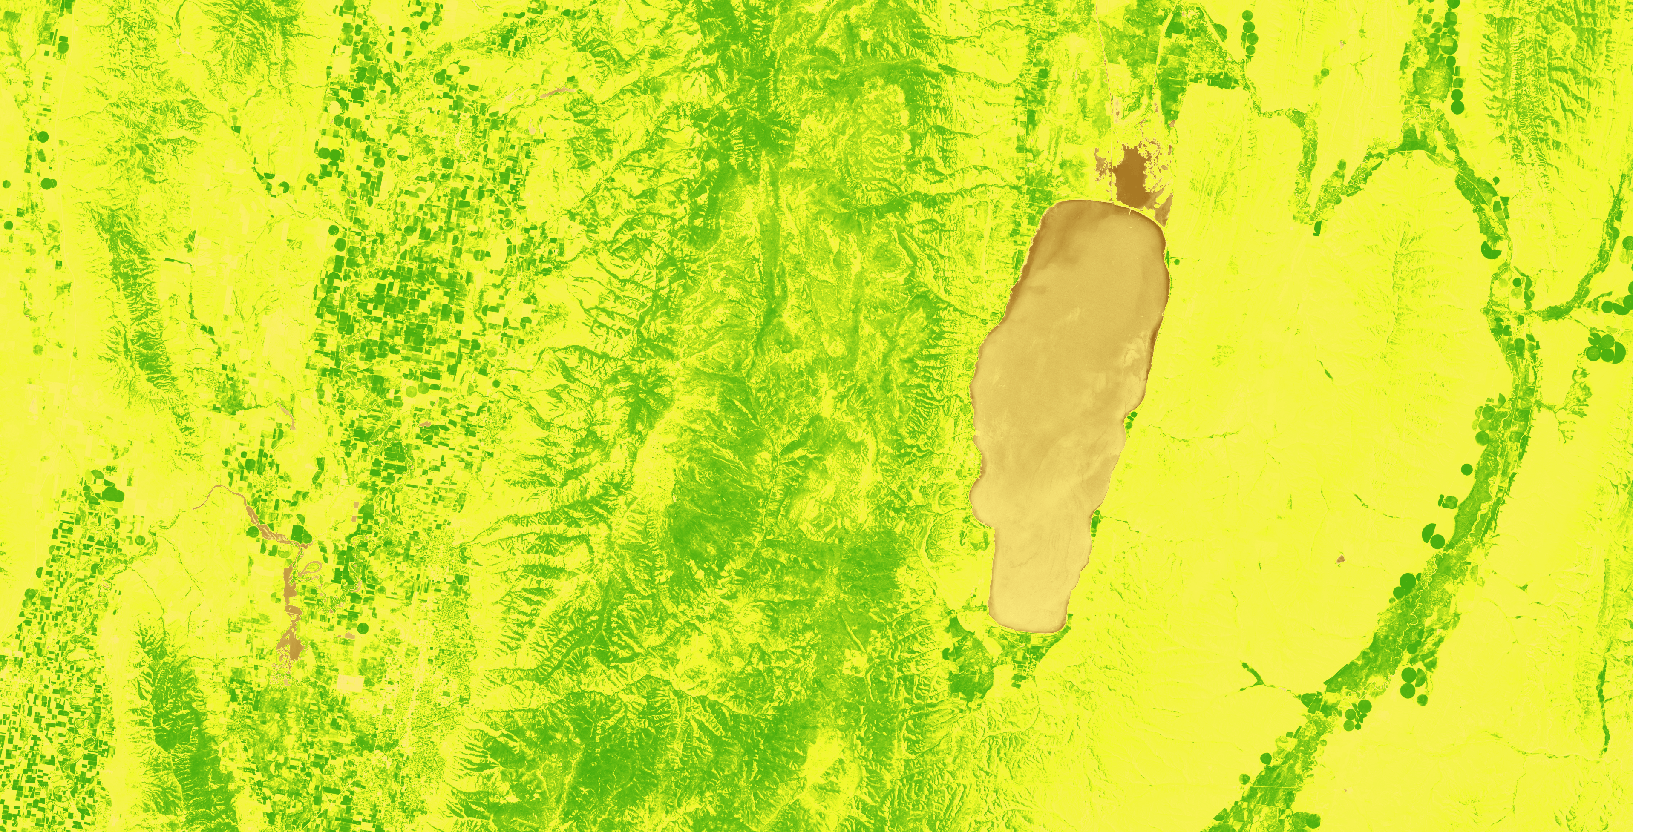
When the raster calculator has finished running the resulting NDVI layer will be added to the QGIS interface. NDVI will be displayed as a grayscale image.
Create Custom NDVI Symbology
Grayscale is a pretty boring way to look at NDVI. You can customize the symbology in the ‘Symbology’ tab of the layer properties. The video at the end of the article demonstrates how to create a colored NDVI map.
Conclusion
NDVI is a simple vegetation index that identifies vegetation ‘greenness’ and is used in many different applications. Calculation of NDVI is simple, the most difficult part is obtaining the data. The QGIS raster calculator is an efficient way to calculate NDVI and other vegetation indices. Learning to use the QGIS raster calculator is an important step to learning remote sensing analysis.