Use QGIS 3D View to Create 3D Maps and Visualizations
Many types of geographical data represent 3-dimensional features. Displaying these data in compelling visualizations can often be difficult when limited to a 2-dimensional screen or piece of paper. Luckily, QGIS has built-in support for visualizing 3D data so that you can show off your data with some exquisite visualizations. Creating 3D maps and visualizations in QGIS is easy and can be done quite quickly.
In QGIS you can create a 3D view in a few simple steps.
- Add a layer that contains 3D data, like a DEM
- Open a new 3D Map View with View > New 3D Map View
- From the 3D Map View window, open the configuration options
- Select Terrain, set ‘Type’ to ‘DEM (Raster Layer)’ and select your layer from the drop-down
- Adjust the view angle to show the 3D attributes
- Customize they layer’s symbology and add more layers for context
Once your 3D view is created it can be saved as an image, as a 3D scene, or added to a map layout. If you’re new to QGIS, follow along and I will take you through these simple steps in greater detail.
Add a Layer with 3D Data
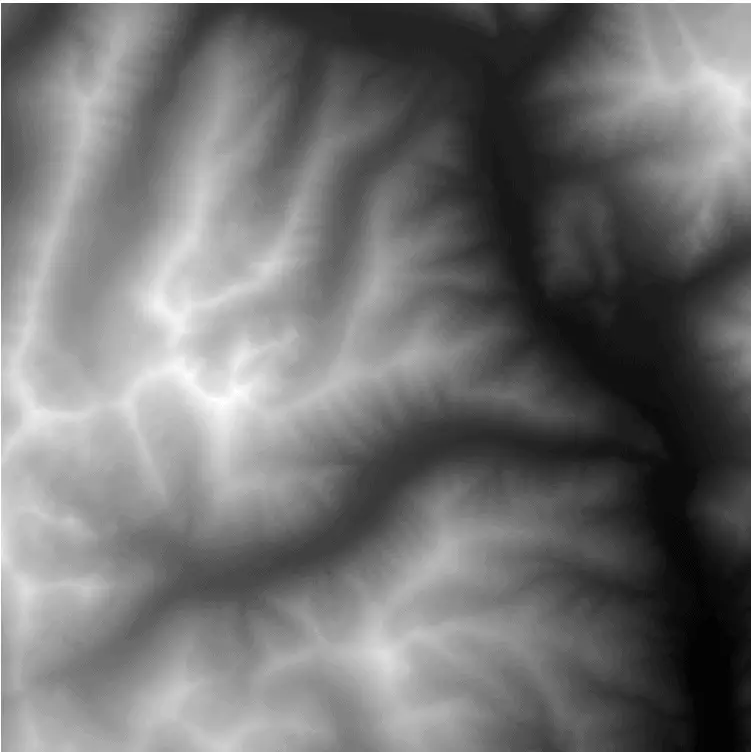
To start, add some type of 3D data to QGIS. 3D visualization work especially well for elevation data. For this example, I’m going to be using a 1-meter lidar DEM. This and similar DEMs can be obtained for free. If you don’t have your own data handy, you can follow this guide to download elevation data for free.
Once you have some elevation data (or other 3D data if you desire). Add it to QGIS. By default, your data will (probably) be displayed in 2D with a grayscale color ramp. You should see an image similar to the one below.
Open a New 3D Map View
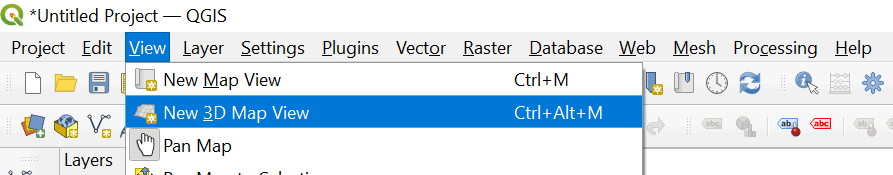
Let’s convert that 2D display to a 3D visualization. This is actually quite easy to do. Simply navigate to the QGIS main menu. Select ‘View’. Then select ‘New 3D Map View’.
Note: Your project must be using a projected coordinate system to open a 3D map view. If you are using a geographic coordinate system (like WGS84) you will not be able to open a 3D map view.
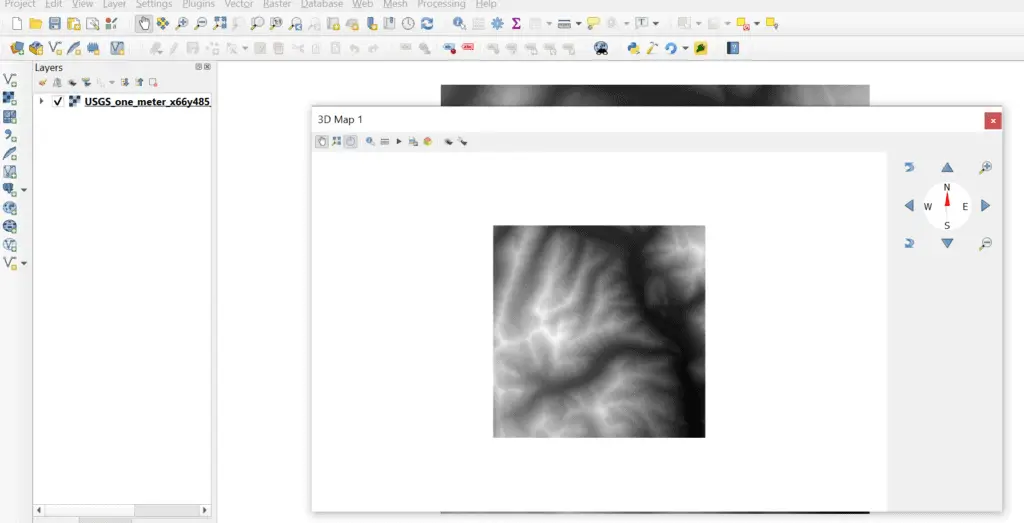
After selecting ‘New 3D Map View’ a new window will open. Your data will be displayed in this window in 2 dimensions (as in the image below). Before a 3D visualization is available we need to configure the viewer so it knows how to display the data. Don’t worry this is really simple, especially with a DEM and I’ll walk you through it in the next section.
Configure the QGIS 3D View
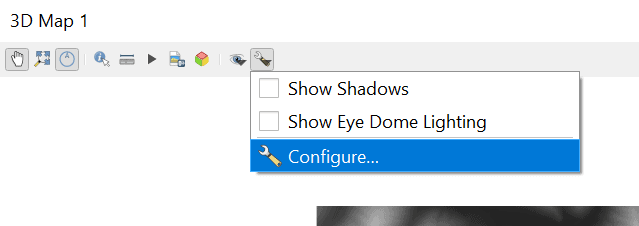
To configure the QGIS 3D view, click on the wrench icon in the 3D view toolbar and select ‘Configure’ from the drop-down menu. This will open up a new window with configuration options.
We just need to change two configuration options for our DEM to display in 3D. In the left pane make sure ‘Terrain’ is selected. Then, from the ‘Type’ drop-down, select ‘DEM (Raster Layer)’. Now, from the ‘Elevation’ drop-down, select your raster layer.
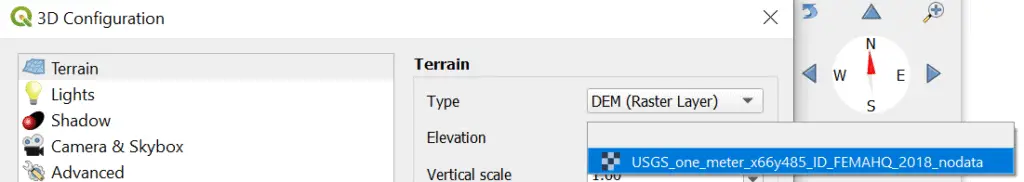
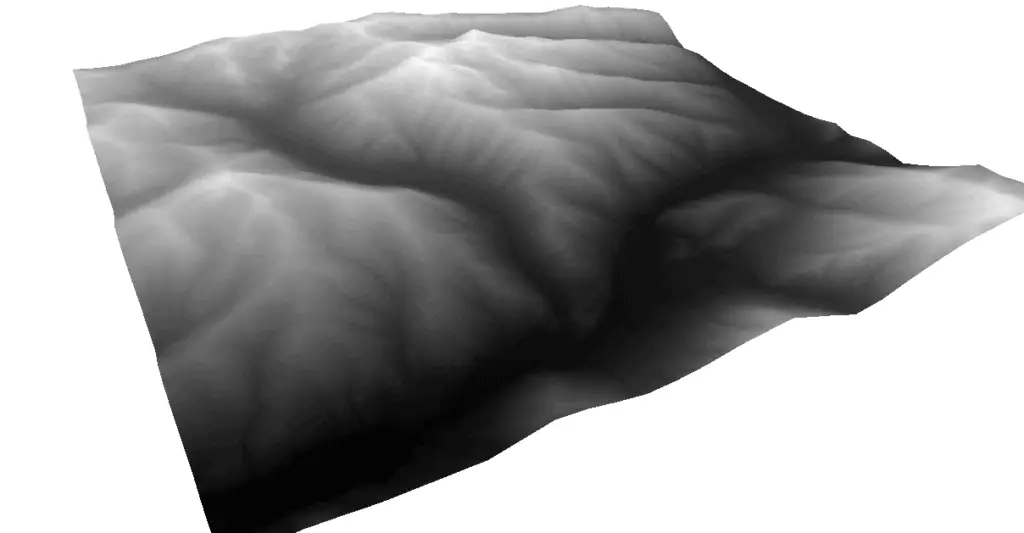
Once you have everything set up as described and shown in the image above, click ‘OK’ and your raster will be displayed in 3D. Below is my raster displayed in 3D
Navigating in QGIS 3D View
You can navigate QGIS 3D view using your mouse or the controls in the top-right corner of the 3D view window. The 3D view control panel is fairly intuitive to use. The N, S, E, and W arrows pan in the specified direction. The curved, rotation arrows will rotate the 3D surface up or down (Z direction). And the red and white compass arrow in the middle will rotate the surface side to side (X and Y directions).
The mouse controls are also quite simple. Be sure the pan button (white hand) is selected in the 3D view toolbar. You can pan around the surface by clicking and dragging. Scrolling with the mouse wheel zooms in and out. To rotate the map in the X, Y, and Z directions, click and hold the mouse wheel and drag.
Navigating 3D view can be a little tedious at first. You’ll find that some small movements can cause the surface to completely disappear. If the surface does disappear and you can’t find it use the ‘Zoom Full’ icon on the toolbar to reset the surface to the starting point.
Spend some time exploring the 3D surface and find a perspective that you find interesting.
Customize the 3D Symbology
Symbolizing the surface is my favorite of any 3D visualization. It’s always an exciting puzzle to find the best way and the best colors to make a visualization informative and interesting. Adjusting the symbology of the 3D surface is simple. All you have to do is change the symbology for the raster layer and the 3D view will automatically update.
To change the raster’s symbology, you can go to the Symbology tab of the layer properties. However, my preferred way is to use the QGIS Layer Styling panel which allows you to see the changes in real-time and make quick adjustments.
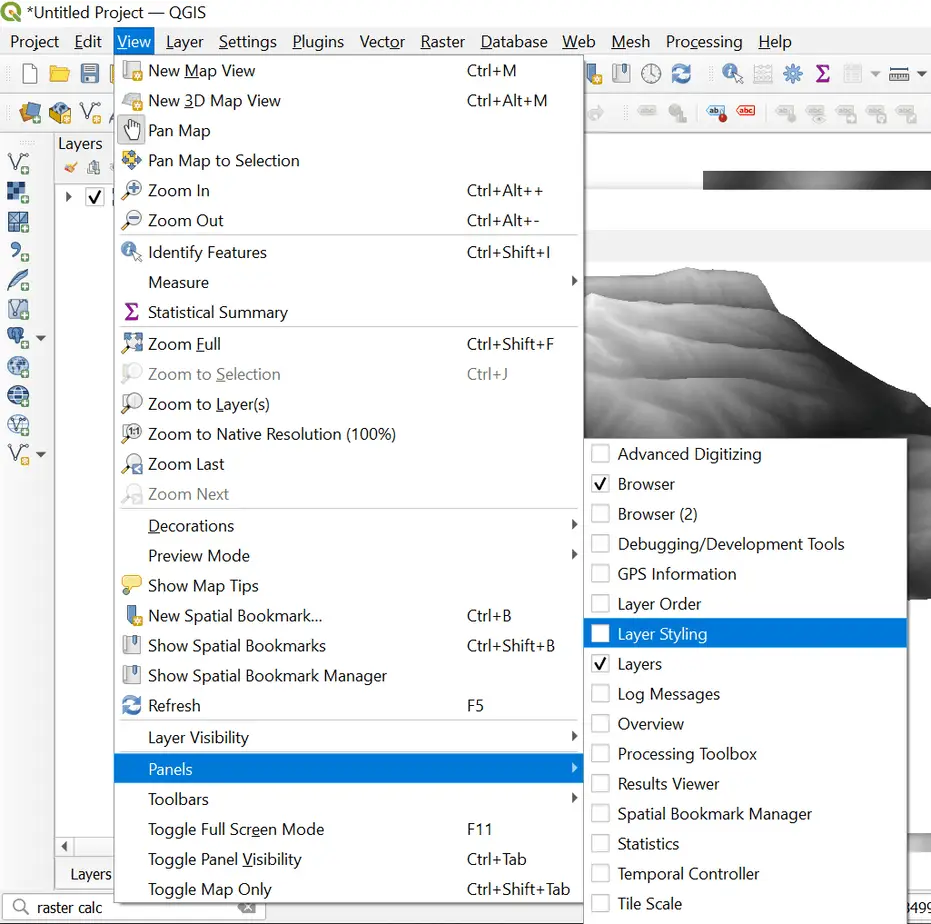
Open the Layer Styling panel by selecting ‘View’ from the QGIS main menu. Then hover the cursor over ‘Panels’ and select ‘Layer Styling’ from the list of options. A new panel will now open in the QGIS interface (probably on the right side of your screen).
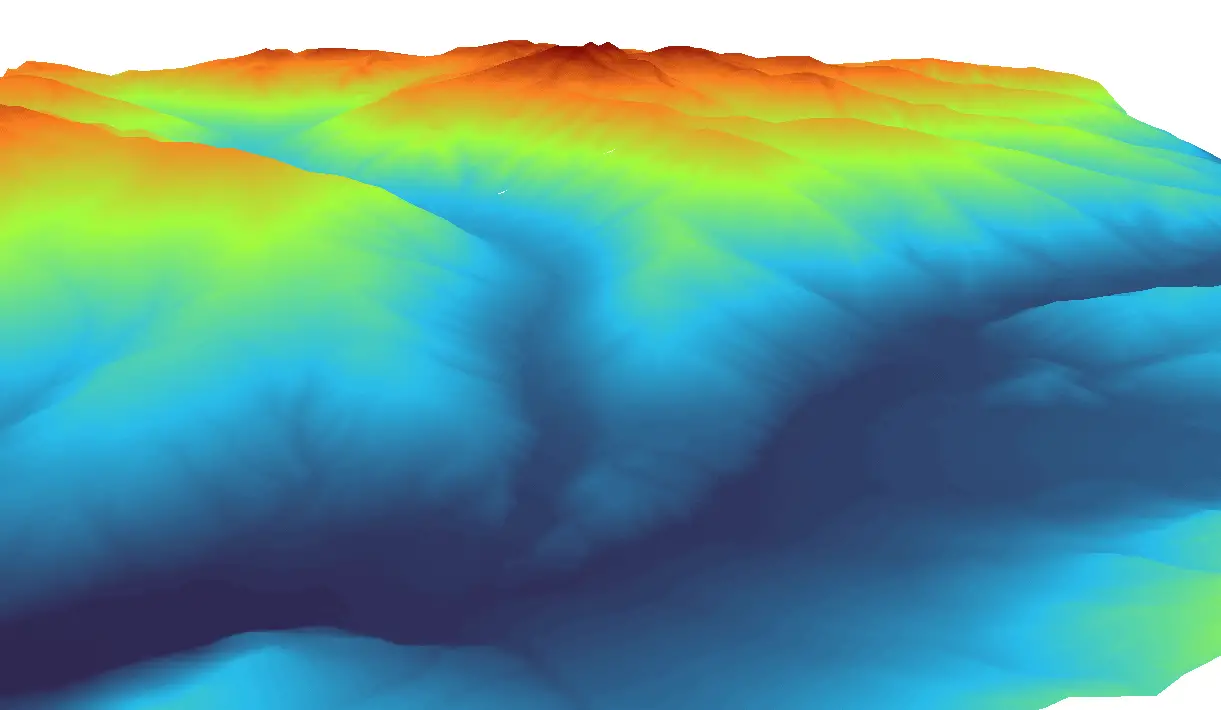
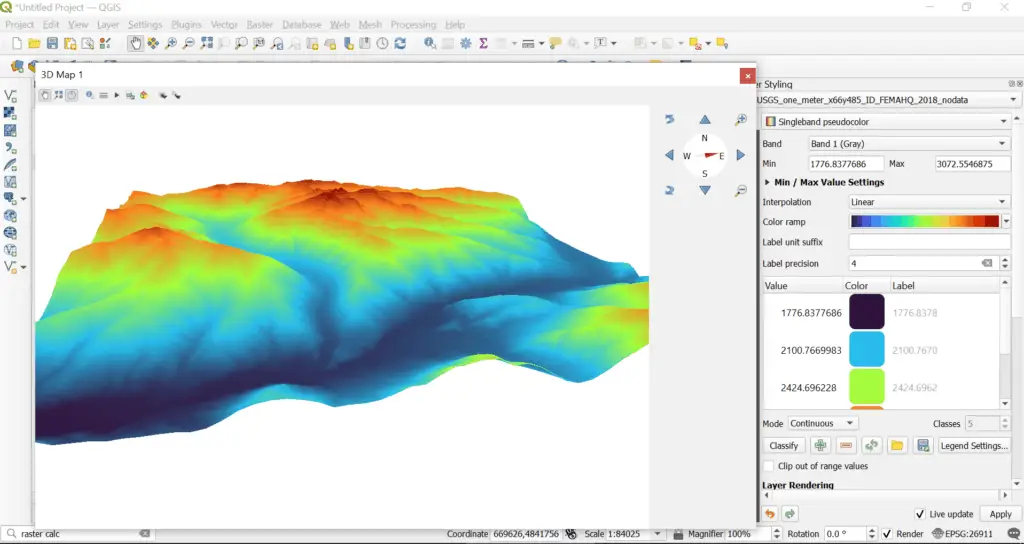
Make sure your raster layer is selected in the top drop-down menu of the Layer Styling panel. Then you can go to work changing the symbology. I recommend switching to a singleband pseudocolor style and experimenting with some different color ramps to see what strikes your fancy. I’ve grown partial to the new ‘Turbo’ color ramp (shown below).
Once you’ve made a 3D view you’re happy with you can export it as an image or as a 3D scene to open in a new program. Both of the export options are available on the toolbar. You can also add the 3D view to a QGIS map layout (see two sections down for instructions).
Create a 3D Surface with Imagery and Other Layers
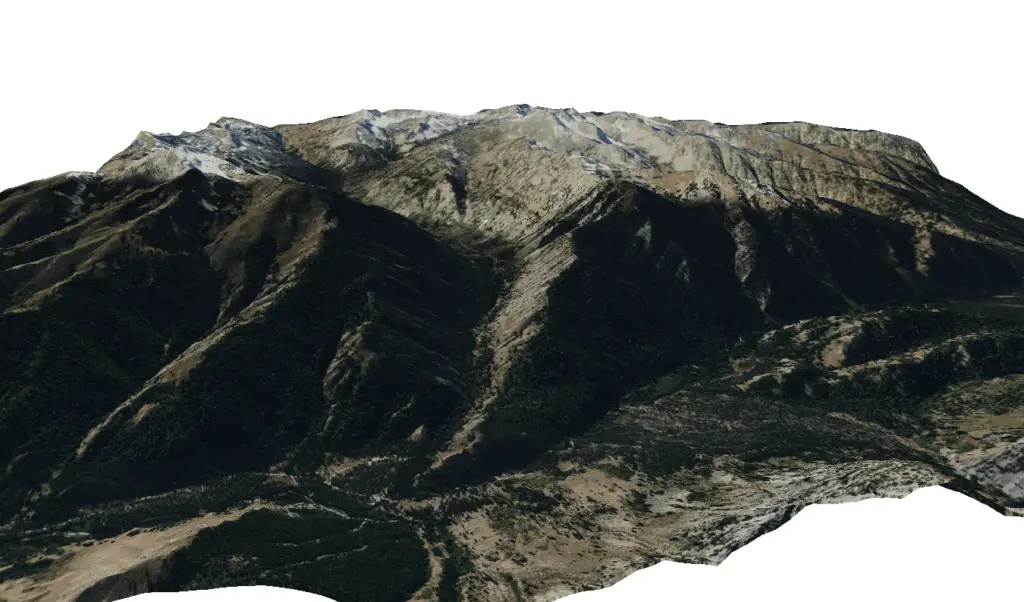
You can also add other layers to your 3D visualization very easily. Any layer you add will display within your 3D view. For example, if you add an imagery layer it will automatically drape over the 3D surface. Add points, lines, and/or polygons and they will also appear on top of the surface. Just make sure they’re ordered properly in the table of contents.
QGIS makes it very simple to create great-looking 3D visualizations.
Add the 3D View to a QGIS Map Layout
You can add 3D maps to map layouts to display them alongside other maps and information.
- You need to have a 3D view open in the QGIS interface
- Create a new map layout
- Select ‘Add 3D map’ from the toolbox or from the ‘Add Item’ drop-down on the main menu
- Click and drag to specify the location of the 3D map
- Select your 3D Map View from the ‘Copy Settings from 3D View’ drop-down
- Select your 3D Map View from the ‘Set From a 3D View’ drop-down
- Now your 3D view will appear in the map layout.
Conclusion
A 3D visualization can really help topography come to life and take your cartography to the next level. QGIS has a powerful, easy-to-use 3D map view that makes it super simple to create visualizations. Take some time to experiment with 3D view to see what else you can learn.
Whether you’re looking to take your GIS skills to the next level, or just getting started with GIS, we have a course for you! We’re constantly creating and curating more courses to help you improve your geospatial skills.

All of our courses are taught by industry professionals and include step-by-step video instruction so you don’t get lost in YouTube videos and blog posts, downloadable data so you can reproduce everything the instructor does, and code you can copy so you can avoid repetitive typing