Download and Display Lidar Data for the United States
Lidar data is awesome! It has so many great uses and produces some amazing visualizations. But it’s not without its problems.
Mainly, lidar data can be difficult to work with because file sizes are so large. This means that point clouds are usually tiled and if the area you’re interested in overlaps multiple tiles then you have to download more data than you actually want to visualize.
This takes time. And it can be tedious to crop and merge the tiles to your specific study area.
Well, your life is about to change. There is now a super easy way to download high-quality lidar data for the United States without worrying about tiles.
The USGS lidar explorer (which is now part of the national map) uses PDAL (the point data abstraction library) to read from cloud-hosted Entwine files (a point cloud file format) directly to your computer.
This is the easiest way that I’ve found to work with lidar data. Stick around and I’ll show you how easy it is.
1. Install PDAL
This might be the most difficult part of the entire process. You need to install PDAL. It’s a command line tool but DON’T BE ALARMED! YOU CAN DO THIS!
All you must do is install Miniconda, open the command prompt, and run one command to install one package. I even have a course dedicated to teaching beginners how to get started with Miniconda/Anaconda. It’s FREE. Go watch and complete the first 5 lessons and you’ll be ready to run the next command. No problem.
When you have the Miniconda prompt open, and your desired environment activated, run this command.
conda install -c conda-forge python-pdal
This will take a little while to install, but when it’s done you’ll be ready to use PDAL.
2. Go to the National Map and find data
Navigate to https://apps.nationalmap.gov/lidar-explorer/.
On the left side of the screen check the box for ‘Show where Lidar is available’. You can also check the ‘Define Area of Interest’ box for instructions to define an area of interest (that’s the next step).
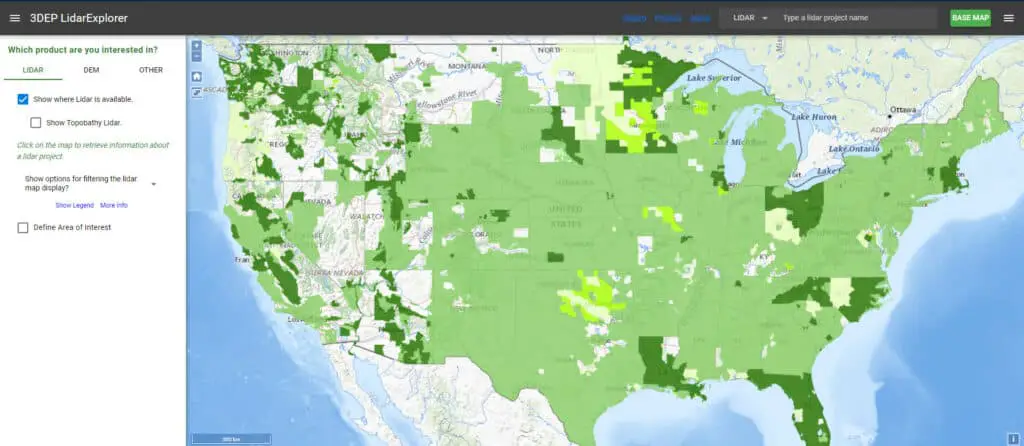
Once you find an area that interests you hold down CTRL while you click and drag to make a box, or use the AOI tool. This will define your area of interest.
The larger your area of interest, the longer it will take to download. It’s probably a good idea to start small while you get a feel for how this works.
3. Specify processing parameters
Once your AOI is defined, click the three vertical lines on the upper-right edge of the map to open the lidar processing menu/panel.
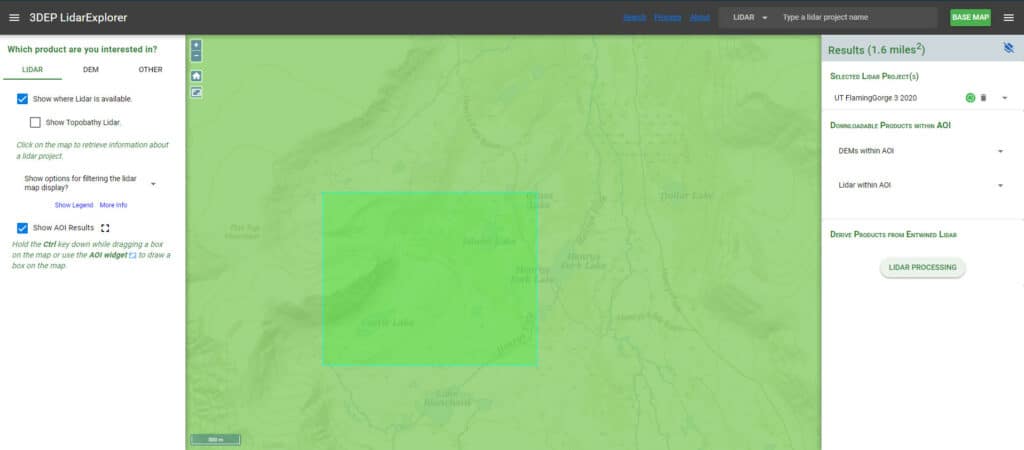
This menu will tell you the lidar projects within your selected AOI. It will also give you the option to download DEM tiles or lidar tiles. You can do that if you want, but remember this tutorial is going to show you a BETTER WAY.
Click the ‘LIDAR PROCESSING’ button at the bottom of the panel.
This will bring you to a new screen where you can specify parameters for your output point cloud. I’m going to leave the default values. You may want to change the output projection or filter by returns or classification, depending on your purpose.
Now we get to the exciting part.
At the bottom of the screen are three green buttons. Save PDAL Pipeline, Process in Cloud, and Show Requests.
‘Save PDAL Pipeline’ (the button we’ll use) downloads a JSON file to your computer that you can use to query and download a seamless point cloud for your AOI.
‘Process in Cloud’ generates a pipeline you can use with an AWS service listed below (Fargate or Lambda) and ‘Show Requests’ gives you the link to download the Cloud Processing Script.
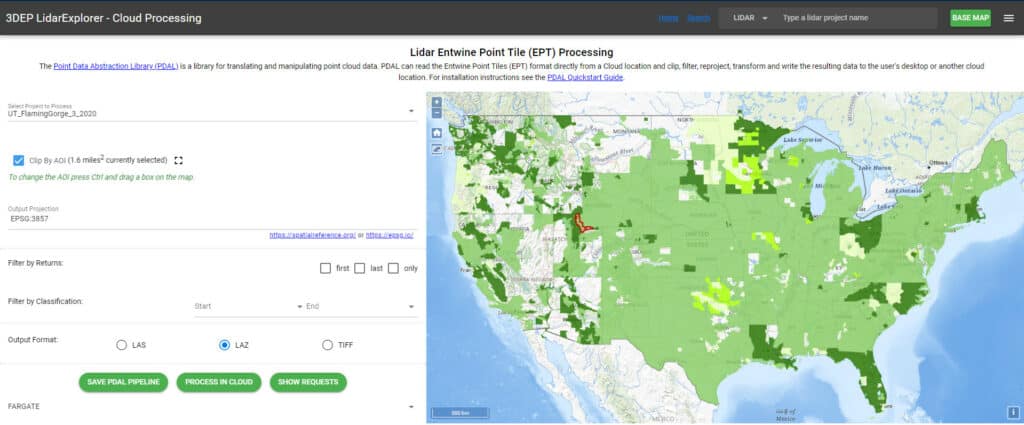
Set the output projection to your desired projection, or leave the default. You can also set a classification range if you desire. I recommend setting the start of the classification range to ‘Unclassified’ and the end to ‘Bridge Deck’. This should get rid of erroneous points.
Select the output format. Again, I kept the default, LAZ.
Now click ‘SAVE PDAL PIPELINE’.
Save the JSON pipeline file (probably named process.json by default) to the directory where you want to download the point cloud.
4. Run the pipeline file to download the point cloud
The processing file you downloaded contains JSON code that looks something like this:
{"pipeline":[{"type":"readers.ept","filename":"http://usgs-lidar-public.s3.amazonaws.com/UT_FlamingGorge_3_2020/ept.json","bounds":"([-12291902.876235623,-12288943.16805813],[4984457.558243322,4986848.943404189])"},{"type":"filters.range","limits":"Classification[1:17]"},"output.laz"]}
It specifies a file type, file location (in the cloud), extents, an output file, and other information about what to download.
Go back to the Minconda prompt.
Navigate (cd) to the directory where you saved the pipeline. You’ll enter a command something like this: cd path/to/directory.
Enter the following command and press enter. This will begin the download. The point cloud will be downloaded to the file ‘output.laz’.
pdal pipeline process.json
This will run the pipeline and start the download. You just have to sit back and wait for it to complete.
Don’t worry if you see a message (or a lot of messages) like this:
(pdal pipeline writers.las Warning) Classification 146 can't be written to LAS 1.2. Replaced with value 1.
It’s not a problem, everything will turn out fine.
The download is going to take some time. Maybe as long as an hour, depending on the size of the area you selected and your internet connection.
5. Display in QGIS
Lidar point clouds are really easy to display in QGIS.
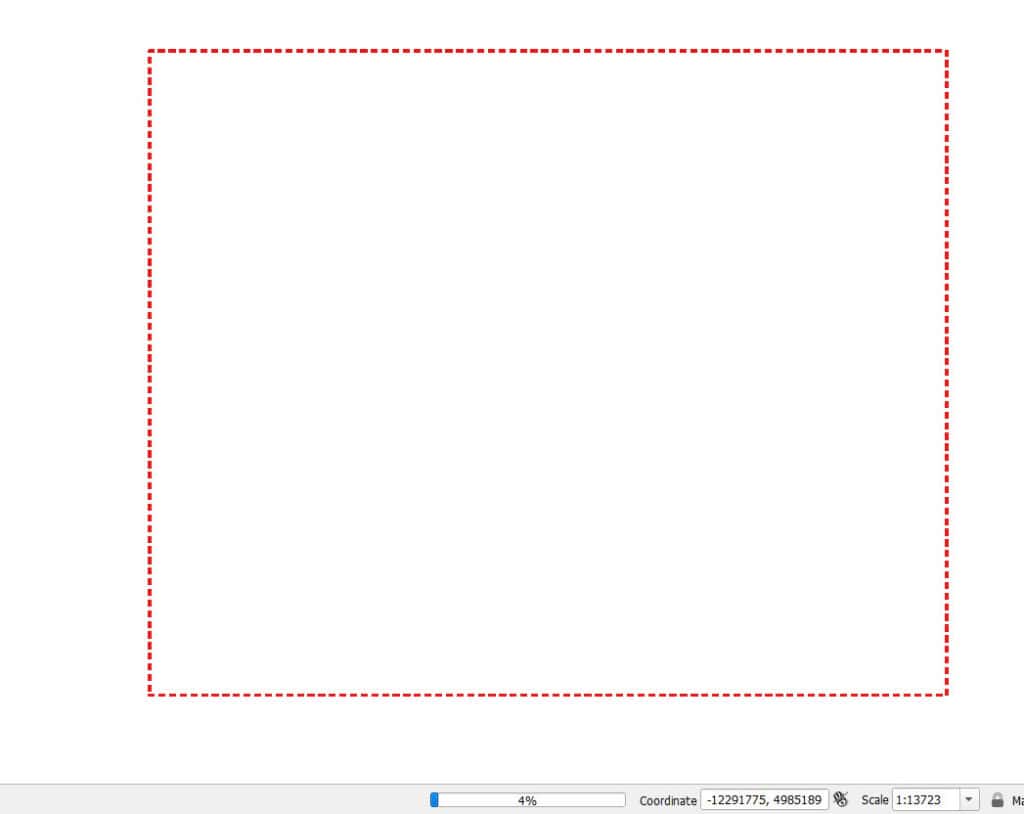
Open QGIS. In the browser panel find your laz file (output.laz). Drag it onto the map canvas. At first, you’ll just see a dashed red outline of the extent. At the bottom of the interface, you’ll see a progress bar. It’s going to take some time to load all the points.
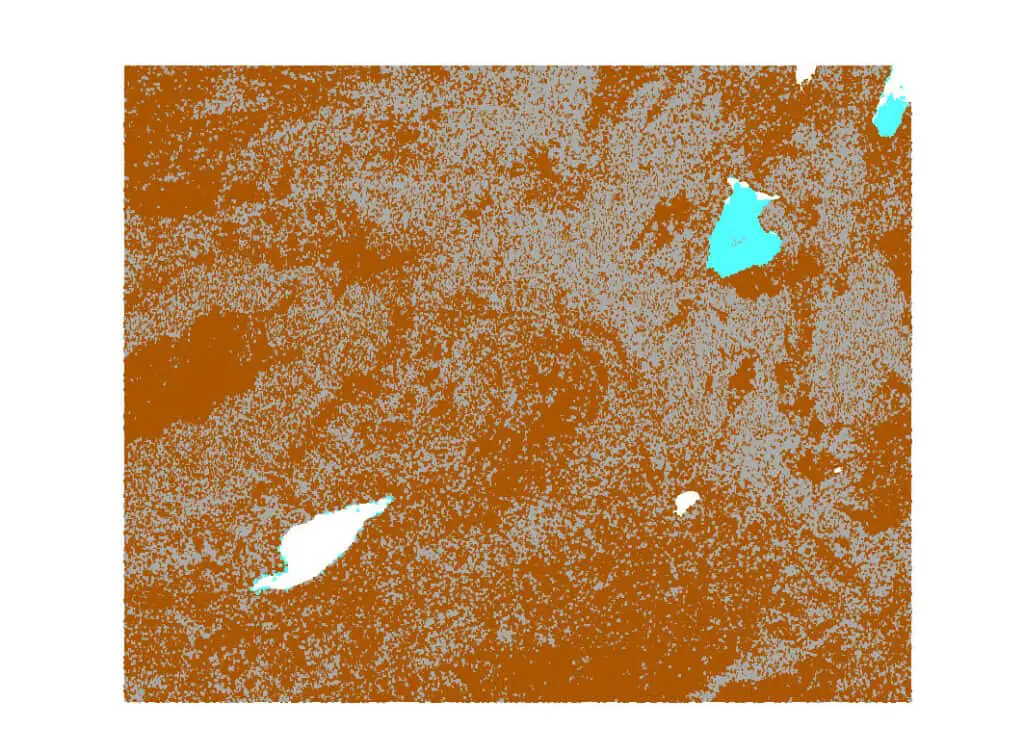
Once the points are loaded they’ll display automatically, probably showing the classification.
Open the layer properties for the layer. Go to the statistics tab. Copy the minimum Z value.
Now go to the elevation tab. Paste the minimum Z value in the Offset box and make it negative. This will make the 3D display easier to deal with. Click OK.
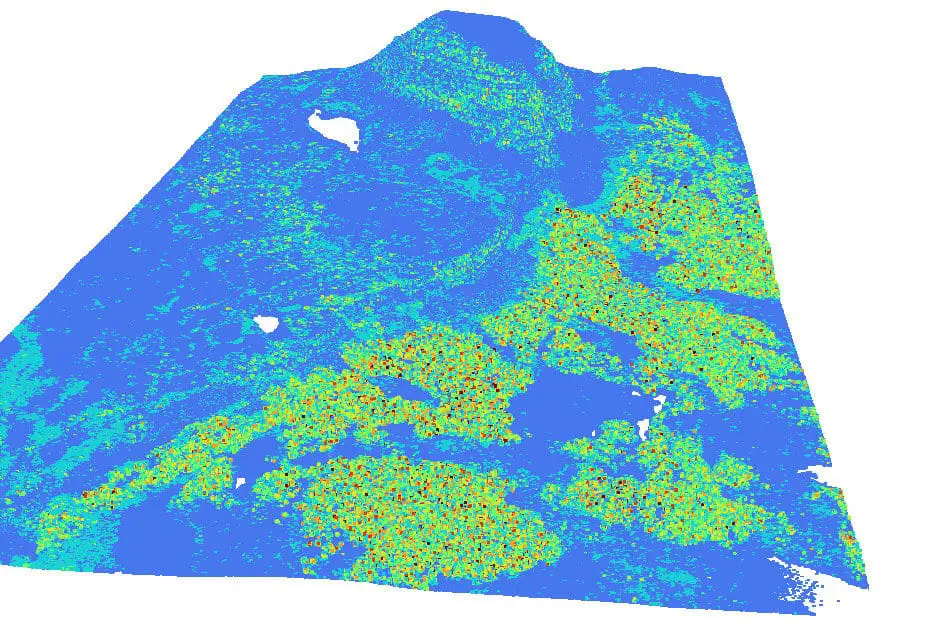
Open a new 3D View (View > 3D Map Views > New 3D Map View). Your point cloud will automatically display in 3D.
Click the mouse wheel to rotate around the view. Scroll to zoom in or out. Left-click and drag to pan.
You can change the visualization and symbology from the symbology panel. Symbolizing the number of returns will help you visualize vegetation.
That’s it, you did it!
Good work. Now you know the easiest way I’ve found to download a seamless point cloud and quickly display it. If you work with lidar data regularly and didn’t know about this already, I hope it’s a game-changer for you!