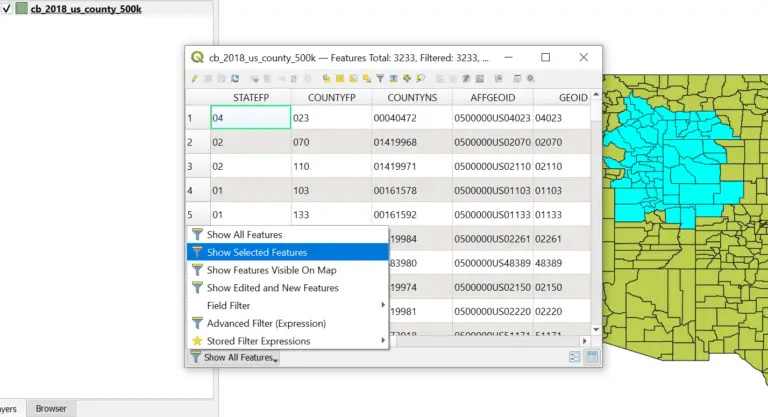
How to Install GDAL for Any Operating System
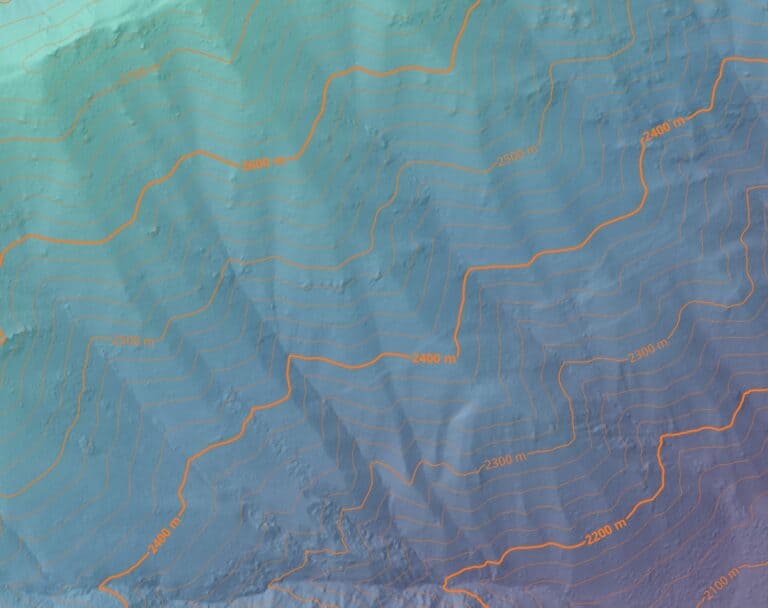
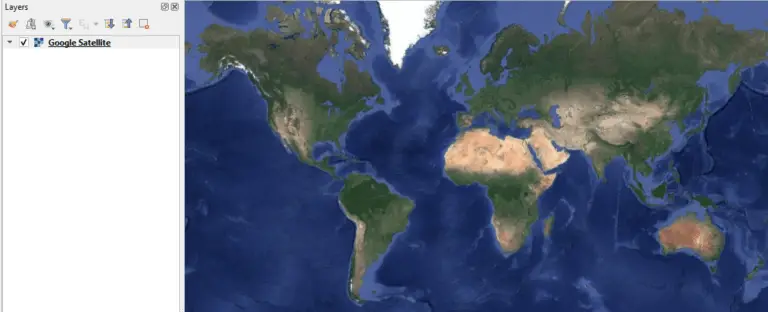
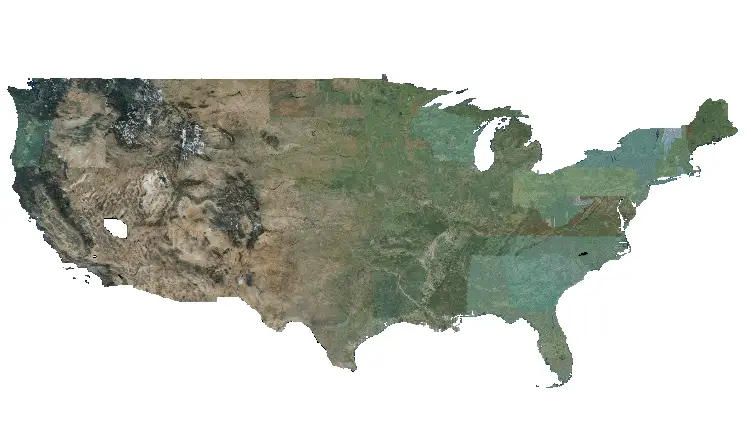
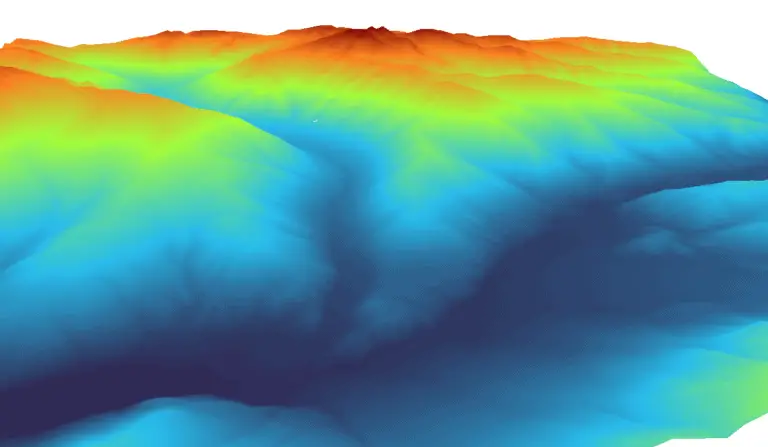
GDAL, the Geospatial Data Abstraction Library, was designed to interact with raster and vector (geospatial) data. Over time it has evolved to include sophisticated data manipulation and analysis tools. The GDAL source code is C++, which makes it fast to run but difficult to install. Many software and applications use GDAL for handling and analyzing…