Remote Sensing Analysis with QGIS
In geographic information science (GIS), remote sensing is the act of acquiring information about the features of the Earth’s surface from a distance. Remotely sensed data are acquired from many different platforms including, satellites, aircraft, and fixed instruments with many different sensors including, spectral imagery (cameras), lidar, and radar. The most common form of remotely sensed data is satellite (and/or aerial) imagery. Photos of the Earth’s surface.
To fully realize the value of these photos, they must undergo analysis to formally identify and label the important features our eyes and brains identify so that those same features can be identified and analyzed by computers. The science of remote sensing includes the collection of remotely sensed data and the subsequent methods to analyze the collected data. The purpose of this article is to help you become familiar with methods for analyzing remotely sensed data in QGIS.
Why Use QGIS for Remote Sensing Analysis?
QGIS is a powerful, cross-platform, free, open-source software. That means it is available to almost anyone in the world that has a computer running a Windows, Mac, or Linux operating system. QGIS also supports a diverse community of developers and users and integrates with other GIS analysis libraries like SAGA and GRASS. Furthermore, QGIS supports the development of third-party plugins to extend its functionality.
All this means that QGIS is an ideal place to start learning remote sensing analysis without worrying about hefty software pricetags or limiting yourself to a niche software that might become irrelevant, or lose support, in future years.
What Types of Remote Sensing Analysis Can be Performed in QGIS?
Between core QGIS tools, integrated GIS libraries, and third-party plugins you can perform qualitative image analysis, calculate spectral indices, perform unsupervised and supervised classification, and implement custom algorithms. The rest of this article will discuss the basics of how to perform each of these tasks with QGIS. Bear in mind that there is a lot of ground to cover here, so I’ll give basic descriptions and link out to more complete resources with step-by-step directions.
Also, for those interested in a more guided experience where you can follow along with video instruction and data download, check out my Remote Sensing with QGIS course.
Obtaining Satellite Data
All of the analyses that I’ll be discussing and demonstrating will be performed using satellite data. Data from many satellite platforms are available free of charge. These platforms include the Sentinel and Landsat missions, which provide global coverage. You can follow the instructions in this article to download satellite data that you will be able to use in the following exercises.
Image Visualization in QGIS
The first step in remote sensing analysis is to look at the data you want to analyze. This involves opening up the satellite image and panning around to see how different features are represented. Doing this will give you an idea of the specific analyses that may work best for your data and purposes.
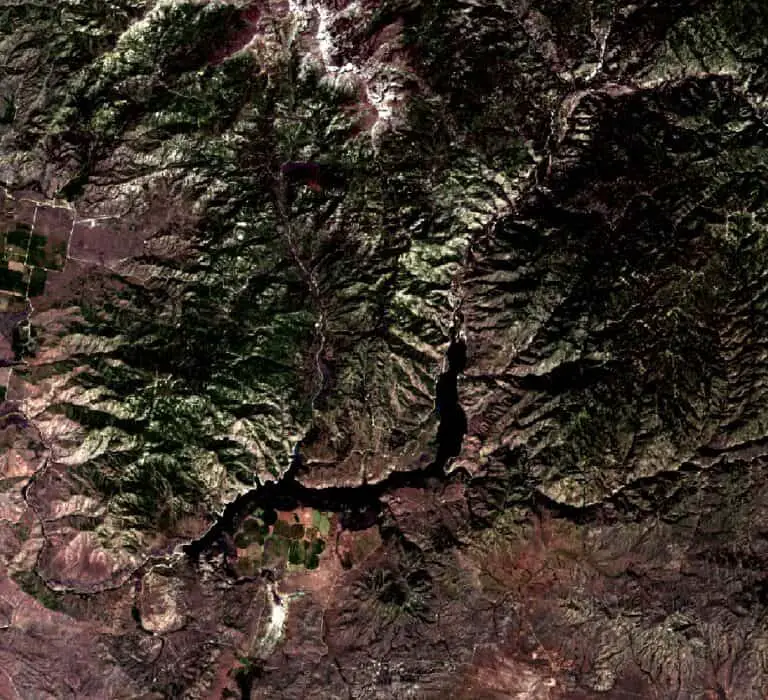
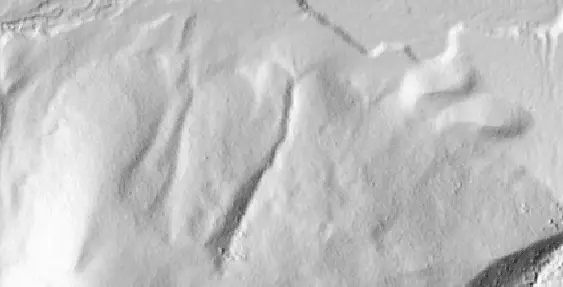
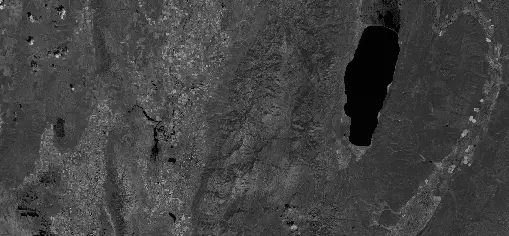
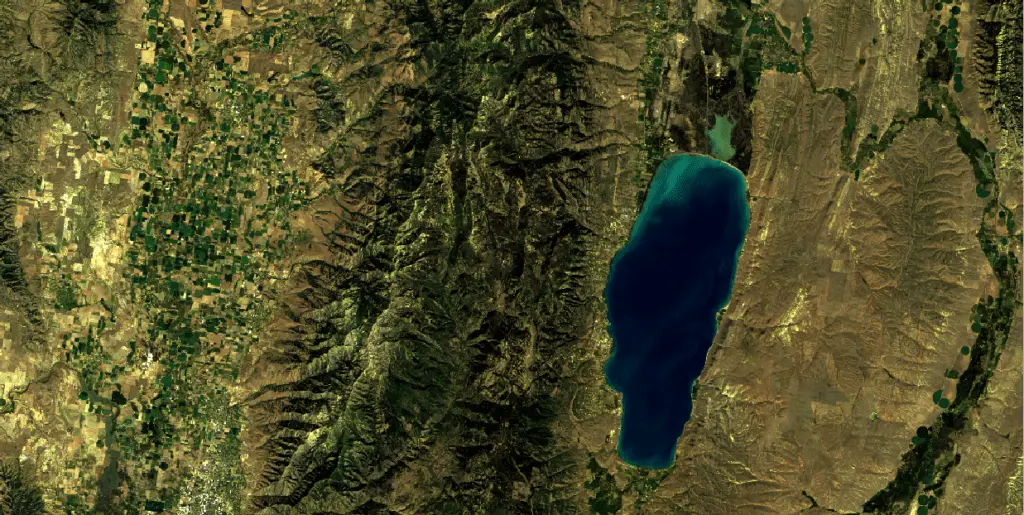
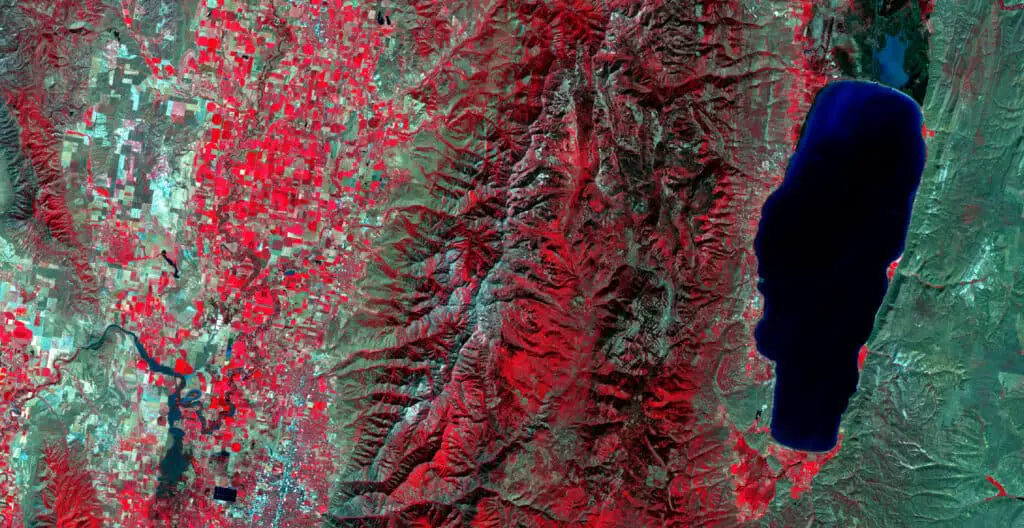
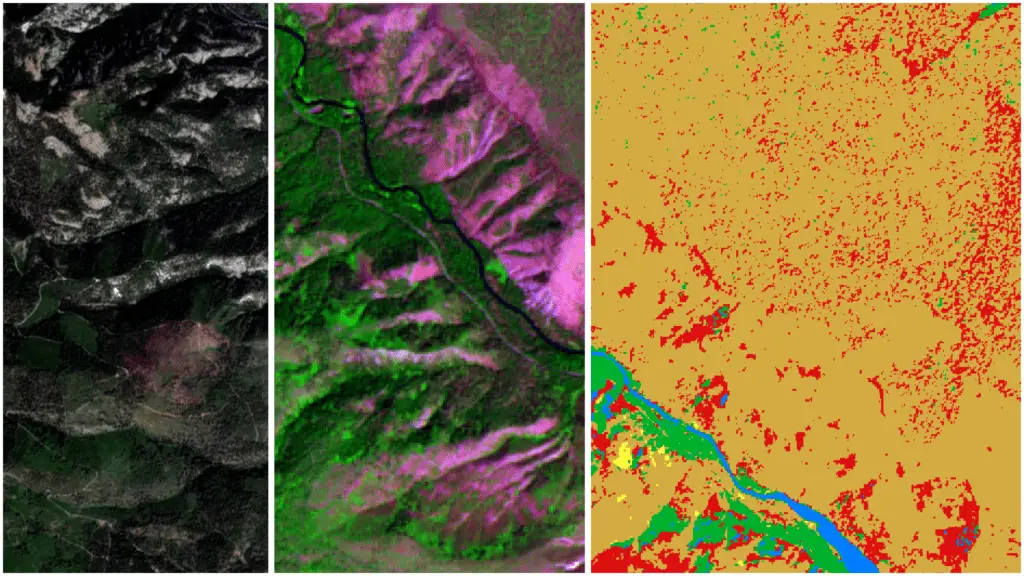
Visualizing remotely sensed data is not always as straightforward as it seems. Often, the images aren’t structured in the same way images from a traditional camera or phone camera are. Data from each sampled wavelength (e.g., red, green, blue, near-infrared) are usually stored in separate data files, and these files need to be combined in GIS or remote sensing software to be visualized. QGIS allows you to easily manipulate the different data bands to create true color and false color images (see photos below) that help you assess the images and identify features within them.
The general workflow for displaying the individual grayscale bands as true color and false color images can be done in two steps with QGIS.
- Create a virtual raster containing all the bands of the satellite image
- Change the display settings of the virtual raster to create true color images and false color composites.
For detailed, step-by-step instructions, follow on how to create these images, you can follow along with this article.
Calculate Spectral Indices
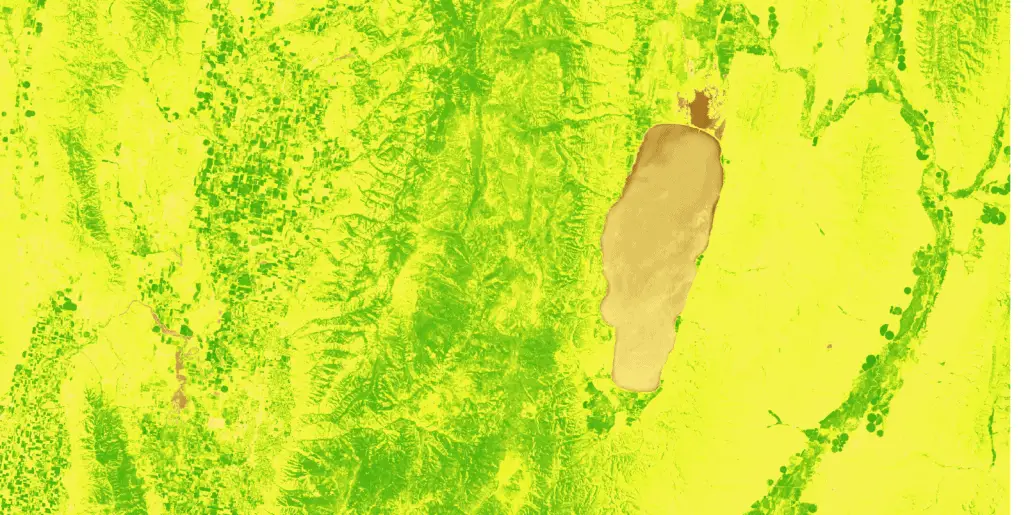
Spectral indices are created by adding, subtracting, dividing, and multiplying different combinations of spectral bands. The resulting values are designed to provide specific information about the land surface. Take the Normalized Difference Vegetation Index (NDVI), for instance.
NDVI is calculated by subtracting the red band from the near-infrared band and then dividing that result by the near-infrared band plus the red band, like this: (NIR-Red) / (NIR+Red).
High NDVI values represent healthy, green vegetation (e.g., chlorophyll). Low NDVI values represent unvegetated areas or the absence of chlorophyll.
There are spectral indices designed to identify the presence of many different land cover types. Some of these indices are the Soil Adjusted Vegetation Index (SAVI), Normalized Difference Moisture Index (NDMI), Normalized Difference Water Index (NDWI), Normalized Difference Snow Index (NDSI), and Normalized Burn Ratio (NBR). These indices are designed to identify soil/vegetation, soil moisture, water, snow, and forest fire extents.
Spectral indices are a great way to get started with remote sensing because they are very simple to calculate and will get you familiar with satellite imagery and basic remote sensing calculations. In QGIS you can calculate these indices using the Raster Calculator. The article below demonstrates how to do this with step-by-step instructions.
Supervised Image Classification
Supervised image classification is the primary, and usually preferred, method to identify different land cover classes from imagery. Supervised image classification is performed by identifying and labeling different land cover classes, then using information from the labels to develop a model to predict land cover over the entirety of an image.
Labels can be created by marking the location and type land cover types in the field, or by visually interpreting images and creating points or polygons to represent land cover classes. The reflectance values from each image band are summarized for each land cover type to create a spectral profile that is used to develop a model that can predict land cover at unlabeled locations.
There are two ways to perform supervised image classification with QGIS. The first, and easiest, is to use the Semi-automatic Classification Plugin (SCP) for QGIS to define regions of interest for land cover classes, develop spectral profiles, and train a classification model. SCP has a full suite of tools to accomplish these tasks and supports multiple predictive modeling methods. This article will walk you through the basics of creating a land cover classification in QGIS using the SCP.
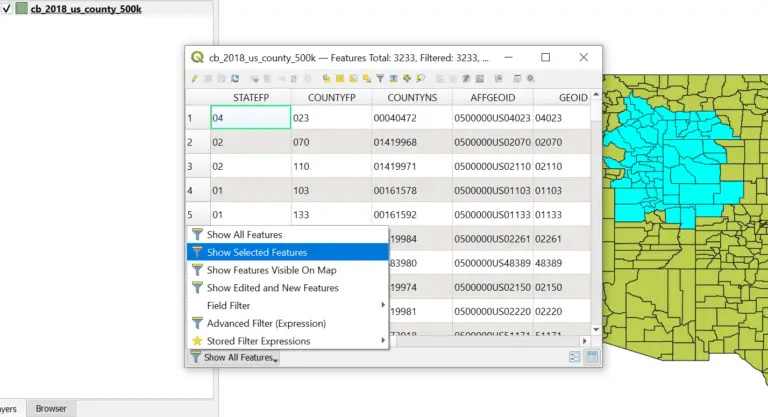
The other option for performing supervised classification with QGIS is much more tedious. It involves creating polygons, or points, in QGIS to define land cover classes and regions of interest. The spectral values representing these classes can then be extracted to a tabular format using QGIS sampling tools. Once the spectral values are available you can develop a model using external software such as Excel to develop a classification model. Back in QGIS, the model can be implemented using the QGIS Raster Calculator.
As you can tell, this approach is much more involved. If you have a need to implement a classification in this manner, I go through a step-by-step demonstration of creating a model for water classification in my Remote Sensing with QGIS course (linked below). For most supervised classificaiton applications I would suggest using the SCP. The remote sensing course also covers step-by-step examples with the SCP.
The other method for image classification is unsupervised image classification, which I’ll discuss below. Supervised image classification has a few advantages (and some disadvantage, which are discussed in the next section) when compared with unsupervised classification.
With supervised classification, the user determines the meaning of each land cover class by identifying the classes directly. These classes can be tuned and adjusted to improve the accuracy of the classification model. And becuase the user chooses these classes they have an inherent meaning.
Unsupervised Image Classification
With unsupervised classification, a mathematical algorithm assigns locations to groups based on the all the reflectance values at a specific location (i.e., pixel). There are multiple ways to perform unsupervised classification with QGIS.
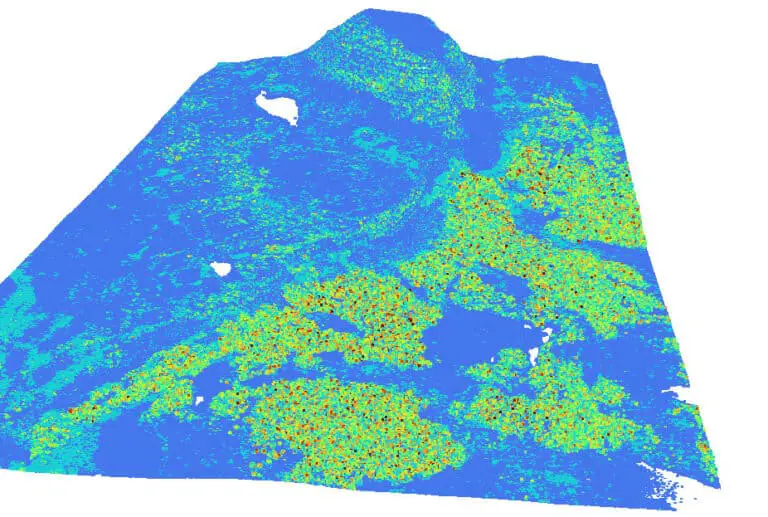
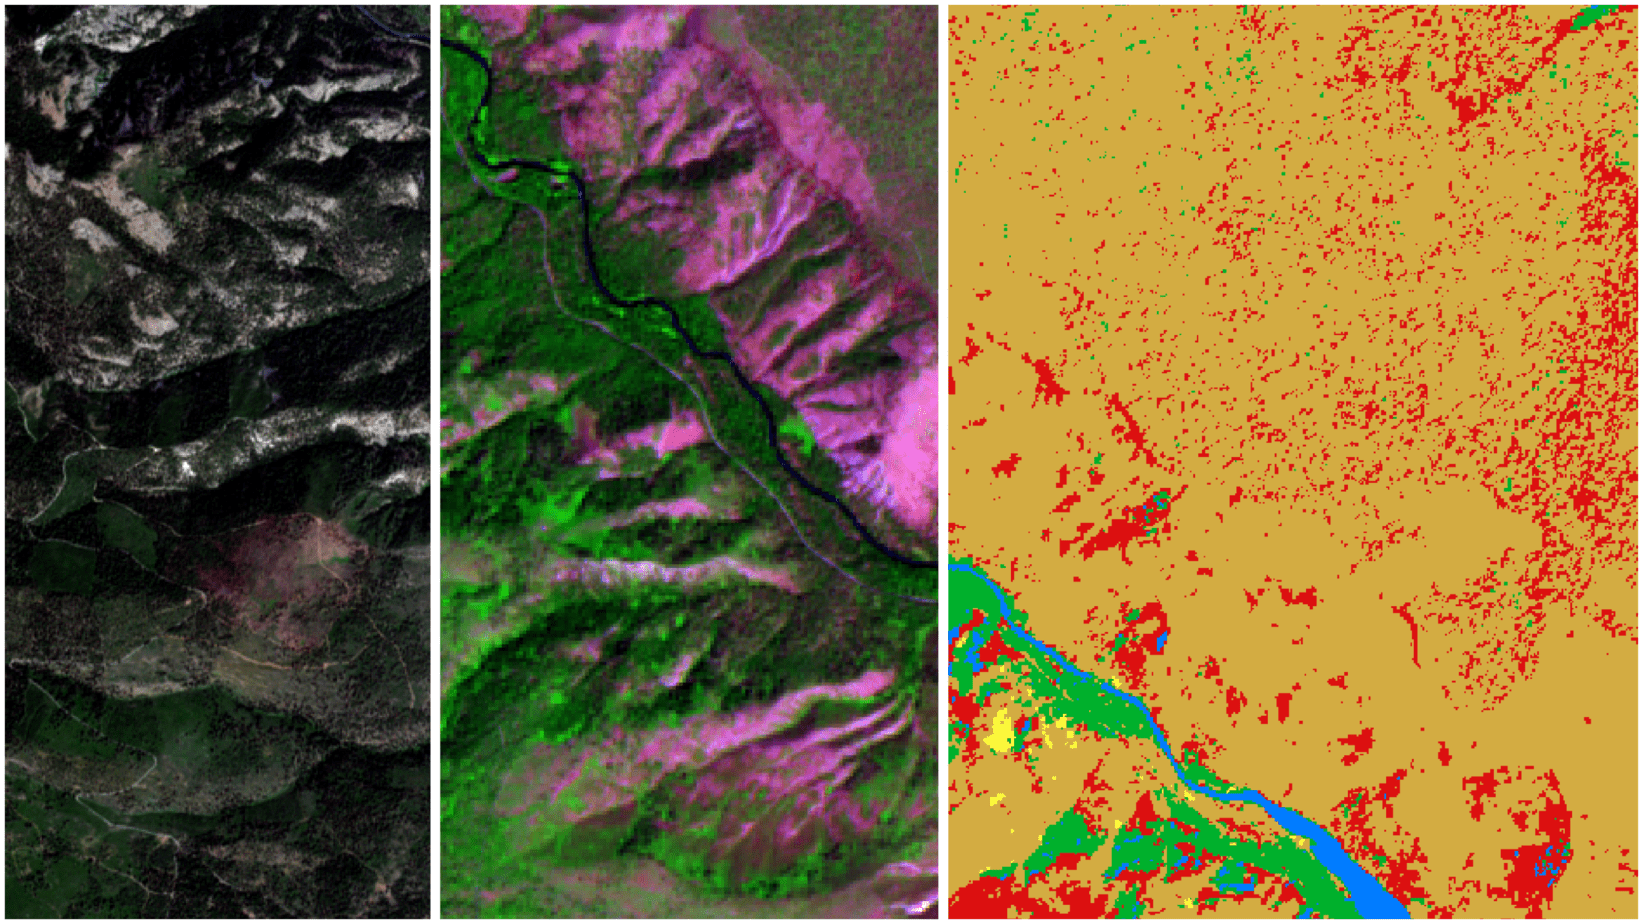
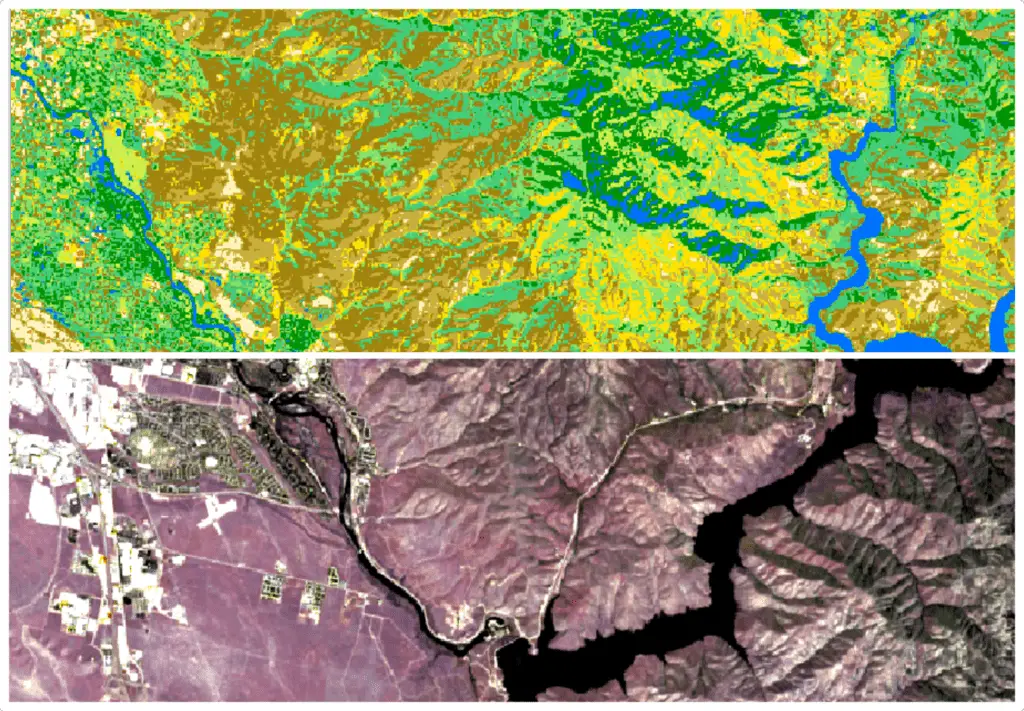
First, unsupervised classification can be performed without installing a plugin by using the K-Means Unsupervised Classification too available in the SAGA toolbox. To use the SAGA tool, you’ll specify the number of classes you want to generate, specify the input reflectance bands to use for the classification, then run the tool. Full step-by-step direction are available in this article and the full remote sensing course. The image below was generated using the SAGA unsupervised classification tool.
Second, you can perform unsupervised classification using the SCP. The SCP has mutiple unsupervised classification algorithms including K-Means and Isodata. Step-by-step instructions for unsupervised classifiation using the SCP (with data provided) are available in my full course.
When compared with supervised image classification there are some advantanges and drawbacks to using unsupervised classification. The biggest drawback is that the classes derived from unsupervised classification have no inherent meaning. The algorithm simply groups together pixels that are most similar. It is up the user to decide if the determined classes actually represent different features on the landscape. Often, the number of classes will have to be adjusted to get meaningful outputs, and it is common for classes to overlap features or for features to be included in more than one class.
The main advantage of unsupervised classification is that it doesn’t require any training data. You don’t have to manually mark locations or draw polygons for the algorithm to identify land cover classes (though you’ll probably want to do some of this to perform a quantitative accuracy analysis).
Custom Algorithms
In addition to the remote sensing analysis methods listed above, you can also implement custom algorithms with the QGIS raster calculator. Using the raster calculator you can implement tasseled cap analysis, principal component analysis, logisitic regression, linear regression, and other models.
The general approach for these implementations is to develop an equation outside of QGIS, once the equation is developed it is then implemented in QGIS by using the Raster Calculator to apply the equation to image bands. I demonstrate this approach to create a logisitic regression model that estimates the probability of water occuring at a pixel in my remote sensing course.
You may also want to check out the remote sensing analyses that are available in the SAGA and GRASS libraries. While these libraries are not native to QGIS, they are included with your QGIS installation and can be called directly from QGIS, expanding the remote sensing tools available to you.
Conclusion
QGIS is a very versatile tool and while its remote sensing applications may seem limited at first, there is a lot of functionality to help you analyze imagery. If you’re new to remote sensing, I suggest you start out by downloading some satellite imagery and loading it into QGIS. Then you can experiement with displaying different band combinations and creating spectral indices. Then move on to implementing classification algorithms. If you’re looking for a more guided experience, with data provided, check out the Remote Sensing with QGIS course that is linked throughout this article. Happy remote sensing!